
While listening to a podcast by Andrew Huberman, the topic of recovery and readiness came up. In it, he stated that measuring your grip strength and something called CO2 tolerance could indicate how recovered you are. I put this to the test, measuring both metrics every morning for 90 days, before comparing to the heart rate variability (HRV) from my Whoop strap.
Testing Protocol
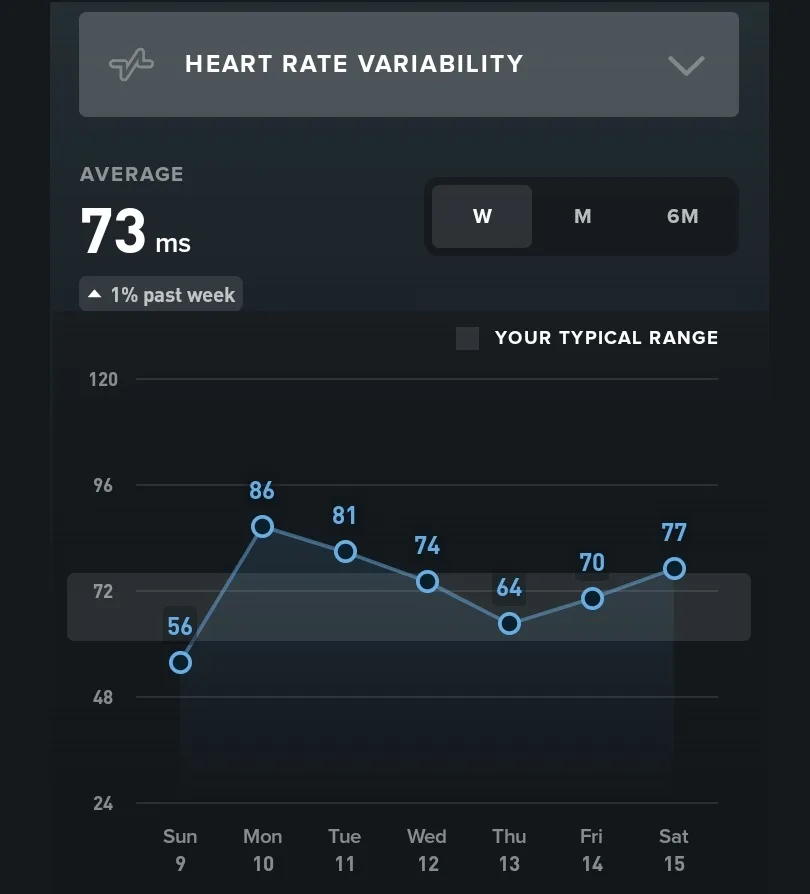
HRV
I’ll start with HRV which is the easiest, because my Whoop strap measures it every night. I also have an Oura ring which does the same, and the two are generally well aligned.
Grip Strength
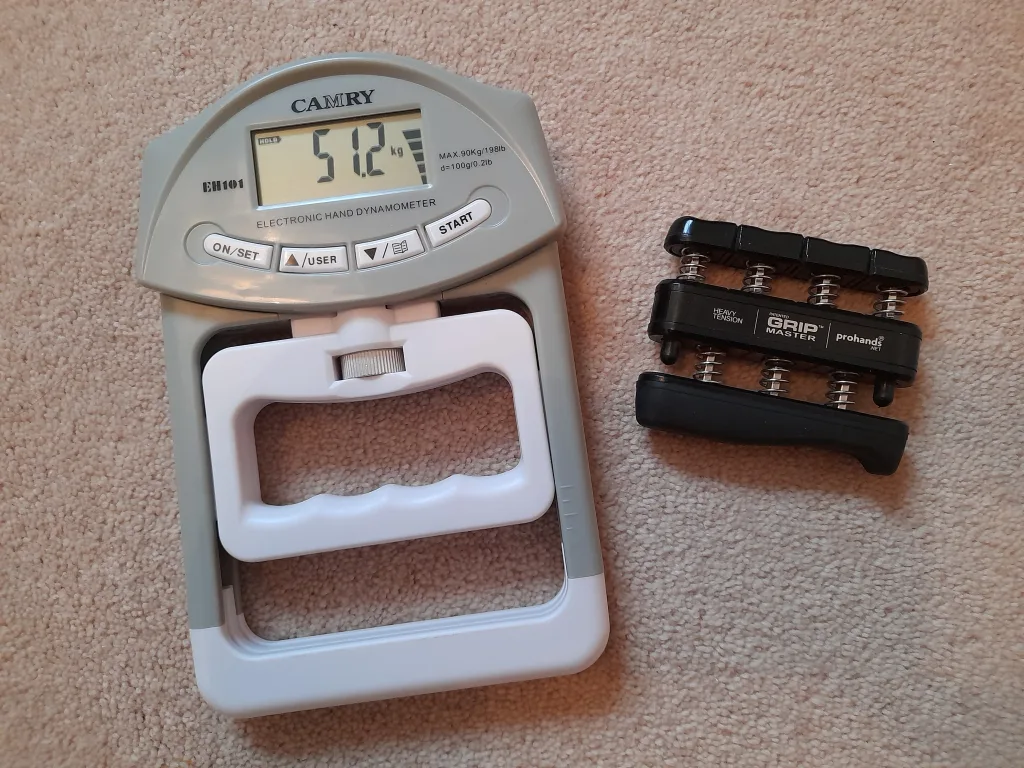
There was no specific protocol given in the podcast about testing grip strength. That said, having done a previous grip strength experiment I know that time of day is a major variable. I chose to test with a single maximum effort from each hand within 10 minutes of waking up. Note that I’m very consistent in my wake up times, so these were all done between 6am and 7am. For testing I used my Camry Hand Grip Dynamometer which I’ve had for a few years and consider a very useful tool.
CO2 Tolerance
I measured CO2 tolerance using the exact protocol mentioned by Dr Andrew Huberman in the podcast. This is as follows:
- Take a deep breath in through the nose
- Exhale slowly through the mouth
- Repeat for a total of four breaths in and out
- Take a 5th breath in through the nose
- Start the timer and breathe out through the mouth as slowly as possible. He likens it to pretending you’re breathing through a small straw.
- Stop the timer once you can no longer breathe out any more. You are timing the duration you spend exhaling and not the time before you next need to take a breath in.
This was another test done within 10 minutes of waking. Initially I lay on my back but I kept on needing to swallow mid-exhale which felt like it was influencing my total time. I settled on a child’s pose but with my hands placed under my forehead, holding the stopwatch.

Results
90 Day HRV and Recovery score
I’ll first map out what my HRV looked like across the 90 days, and then we can see how the new variables measured up.
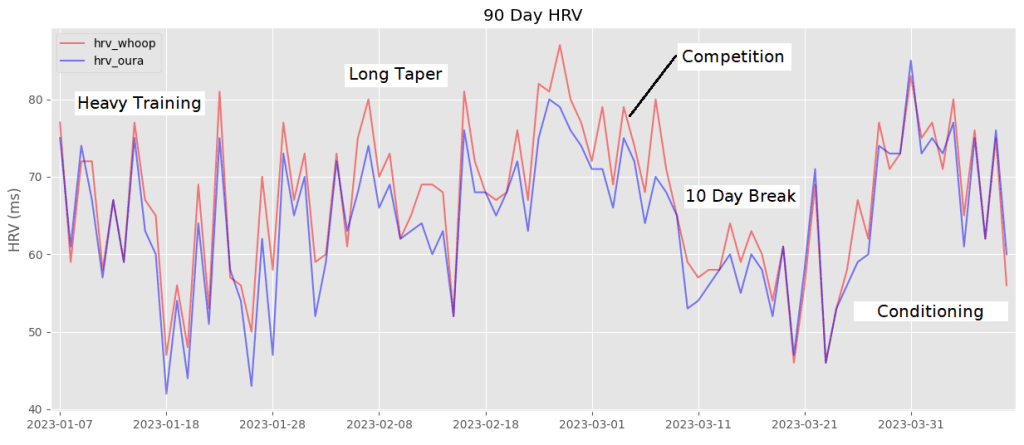
The main driver of HRV is activity levels, which I’ve annotated on the graph. You can hopefully see a trend for average HRV to rise between 2023-01-28 and 2023-03-01 during a taper*. The competition was on 5th March, followed by a 10 day break. I was really surprised to see my HRV consistently low during my break, but on reflection the taper is a form of recovery so I was already incredibly fresh for the competition. Finally, I jumped into my summer training program on 2023-03-17 and since that starts with GPP (general preparation phase) I saw a rise in HRV.
*A taper is a deliberate reduction in training load allowing you to peak for a competition
It should be noted that HRV is not the same as recovery, but it’s given a high weight when Whoop calculates it. Below is the relationship between HRV and Recovery, the latter of which I’ll use to compare with grip strength and CO2 tolerance.
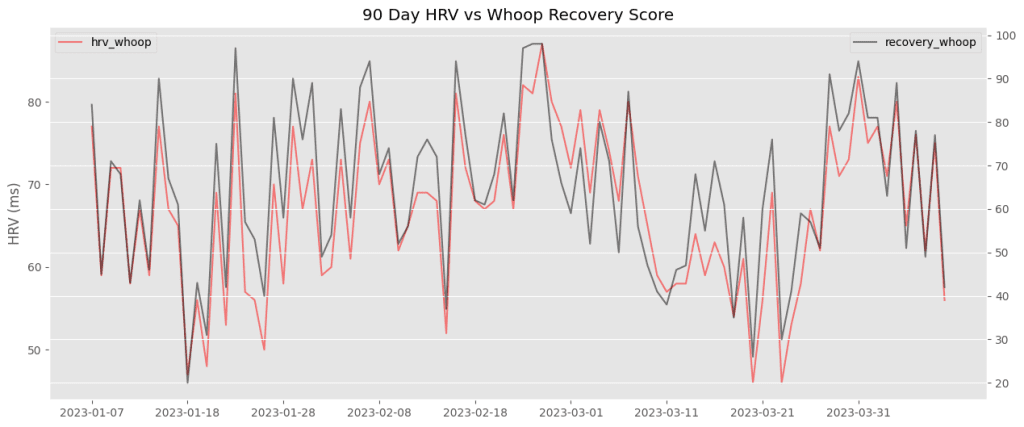
The correlation between these two variables is r=0.916, meaning HRV can tell us a lot about Whoop’s recovery score.
90 Day Grip Strength
First I want to show a comparison between my right and left hand. I’m left handed but tested my right hand first each morning, followed by a 30 second break before testing my left hand. I squeezed for 3-5 seconds and jotted down the result.
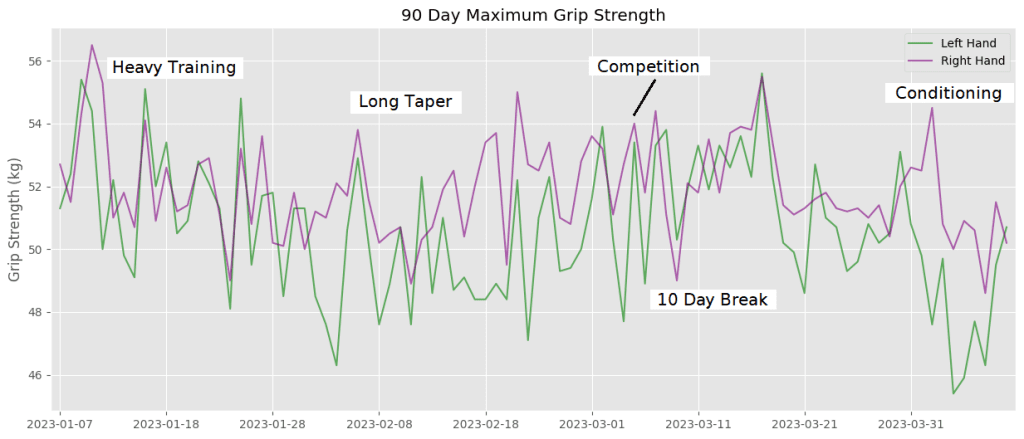
The relationship between the annotated training periods and grip strength is far less clear. It’s easiest to read by focusing on one colour at a time. My right hand (purple) is pretty stable up until the start of my summer training, where it takes a dip. My left hand (green) dropped during the taper and picked up again for the competition and the 10 day break.
Two things I would note:
- The taper involved reducing upper body weights so my grip might have initially recovered and then encountered a de-training effect.
- In April I started removing the wallpaper in my study using a scraper tool exclusively in my left hand. I don’t believe it’s a coincidence that only my left hand dropped off in strength during this period.
Grip Strength vs Whoop Recovery
In the comparison graph below I’m taking the highest grip strength score from either hand each day. The podcast also mentioned that a 10% reduction in strength from baseline is a sign of poor recovery, so that has been highlighted in red.
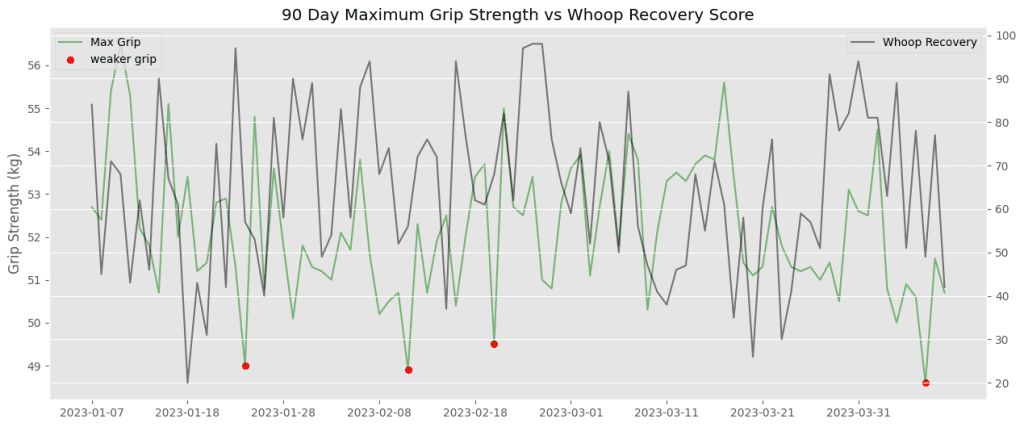
The correlation between maximum grip strength and Whoop recovery score is r=0.026. What that means is grip strength has little to no relation to recovery score. I also checked the four days where I had weaker grip and there was nothing special about them.
90 Day CO2 Tolerance
There’s a lot of graphs in this article already so I’m going to jump straight to the comparison between CO2 tolerance and Whoop recovery.
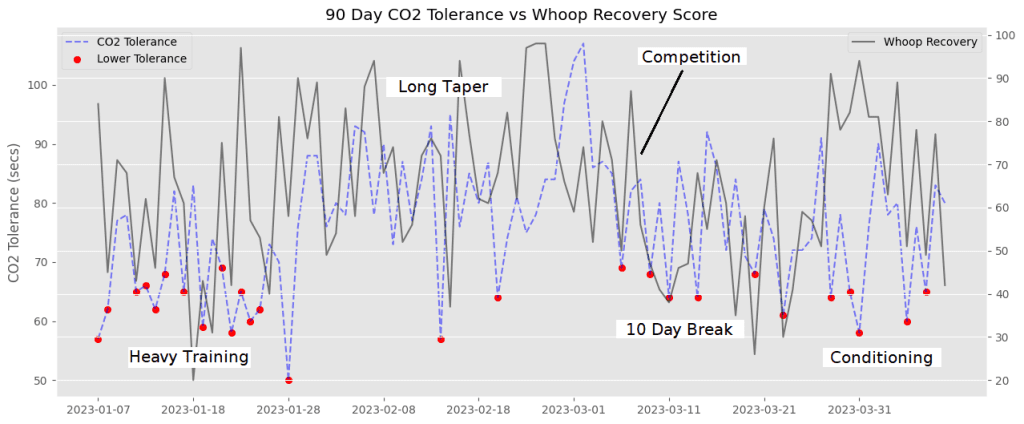
I’ll be honest, for the first three weeks I thought this was a waste of time. I was averaging 67 seconds and not seeing any scores that were 20% below my baseline. As soon as I reduced my training load it dawned on me that most of January was 20% below my baseline. The problem was that I started measuring in a period of heavy training so I didn’t know what scores I could achieve when fresh.
If you average the best 18 scores across the 90 days you end up with 87 seconds. A 20% reduction is therefore below 70 seconds, which I’ve highlighted in red. You can see that during my taper I only had two days out of 33 below 70 seconds. Compare that to 14 of my first 21 days during heavy training.
However, the correlation between CO2 tolerance and Whoop recovery is r=0.109, meaning it’s only marginally better than random.
Is CO2 Tolerance better than HRV?
The implication from comparing everything to my Whoop recovery score is that it’s some sort of gold standard. This is not the case. While I generally perform better on “green” days (Whoop recovery 67% or higher) it’s by no means perfect. For instance, I was supposedly only 71% recovered on the day of my final competition and my 10 day break had five scores below 50%.
The cluster of low CO2 tolerance times in my heavy training block gives me confidence that it’s measuring something worthwhile. I was feeling very run down in January so it’s fair to say I was consistently under-recovered. I also had a look at my average scores in certain variables compared to the activity I was doing the previous day. The results of this are in the table below.
| Previous Day Activity | Max Grip (kg) | HRV (ms) | Whoop Recovery (%) | Oura Readiness (%) | CO2 Tolerance (secs) |
| Conditioning (23 days) | 52.3 | 64.5 | 63.2 | 81.4 | 76.0 |
| Rest (34 days) | 52.3 | 65.9 | 64.5 | 86.9 | 76.2 |
| Sprint Session (27 days) | 52.0 | 65.9 | 65.7 | 82.0 | 73.8 |
Conclusion
We can start with the obvious, which is to say that grip strength is not a good global measure of readiness. It was clearly influenced by local fatigue (scraping wallpaper) and showed no real relationship to training volume. I also noticed that days I felt like I had a vice-like grip were not necessarily the highest readings. Some of my highest readings felt distinctly average, and days where I could swear I was gripping very well were actually below average.
CO2 tolerance was much better. I feel like it’s capturing something that my HRV and Whoop strap are failing to see. The combination of the two would be very helpful across an even longer period, such as a full 6 month macrocycle. The times were consistent enough that you could potentially test 2-3 days each week. If you don’t have access to HRV, and even if you do, I’d recommend trying the protocol out for an extended period. I can imagine the results might be even clearer for those involved in endurance training.
It’s important to remember that all of these metrics are an approximation and nothing (yet) captures all the elements that influence readiness. Whoop already has a collaboration with Dr Huberman so it may be that CO2 tolerance will one day be included in the app. Thanks for reading!