
I’ve been wearing both an Oura ring (ring finger on dominant hand) and Whoop strap (non-dominant wrist) for two full years. I imported the data to a Jupyter notebook and graphed some comparison metrics, here’s how they look:
Note: data updated 10th May 2024, total of 717 days
Whoop vs Oura: Heart Rate Variability
- Whoop Average HRV: 71.2
- Oura Average HRV: 68.6
- Correlation: r = 0.930
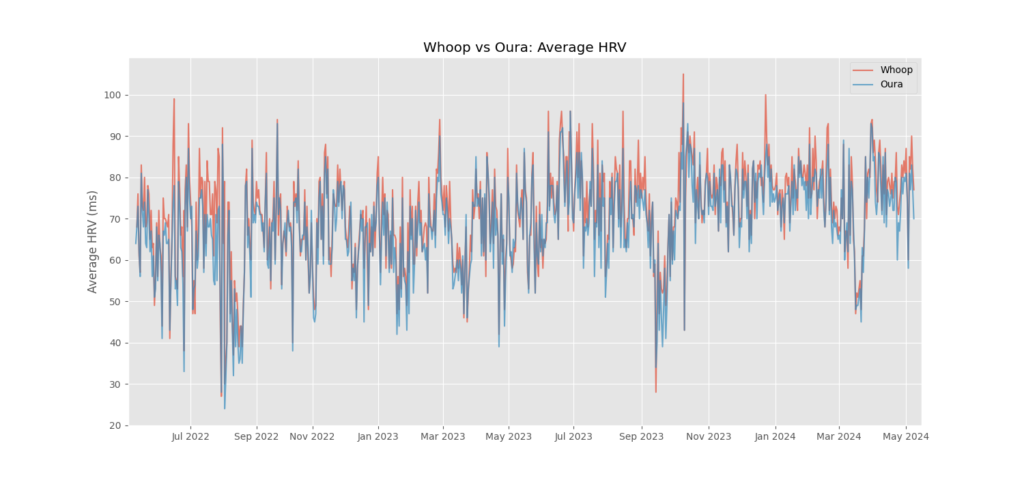
In most cases the Whoop reading is above the Oura for HRV, though only by a few ms. The clearest exception is June 14th 2022 when Whoop reported my HRV at 100ms and Oura at 78ms. Whoop measures HRV during slow wave (deep) sleep, which was shorter than average on this night at 1hr 16. The only other difference to an average night is that light sleep was up at 64% which is well above my typical range. August 2022 involved 12 days with a tooth infection which left my HRV very low and October 2023 was a full month off exercise.
Whoop vs Oura: Resting Heart Rate
- Whoop Average RHR: 51.1
- Oura Average RHR: 51.8
- Correlation: r = 0.985

Very good alignment here. Last year Oura had my resting heart rate in the low 40’s so I’m not sure if the uptick since my November 2021 change to the Oura 3.0 ring is a change in my body or a change in the technology. Again in August 2022 my tooth infection is clearly visible as heart rate spiked above 60 bpm, also other short spikes due to fevers or flu.
Whoop vs Oura: Daily Kcal Burn
I should point out that both profiles are filled out with height equal to 176cm and weight at 71kg, meaning the calculation of Basal Metabolic Rate (calories burned at rest) should be identical.
- Whoop Average Kcal burn: 2426
- Oura Average Kcal burn: 2429
- Correlation: r = 0.691
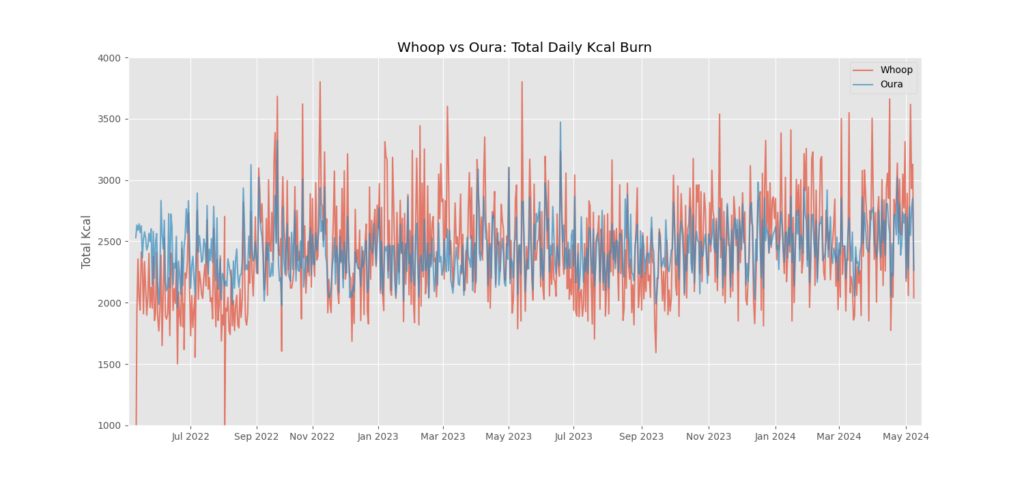
Since September 2022 I’ve been training harder. It seems for low levels of activity Whoop underestimates calorie burn relative to Oura and for moderate activity they are more aligned. Some days in January 2023 I had sessions where Whoop seemed to overestimate calorie burn, particularly my sprint sessions in cold weather.
Towards the end of February 2023 I felt that Whoop went a bit overboard with my workout heart rate. I did a very modest workout and it reported my heart rate sitting above 150bpm most of the time. You can see a clear gap open up between Oura and Whoop on some days, with Whoop reporting 3000+ calories burned.
Whoop vs Oura: Recovery vs Readiness
These metrics don’t claim to capture the same thing but it’s an interesting comparison. Both are shown to you in the morning as a proxy for how much activity you can do that day.
- Whoop Average Recovery Score: 66.2
- Oura Average Readiness: 83.1
- Correlation: r = 0.494
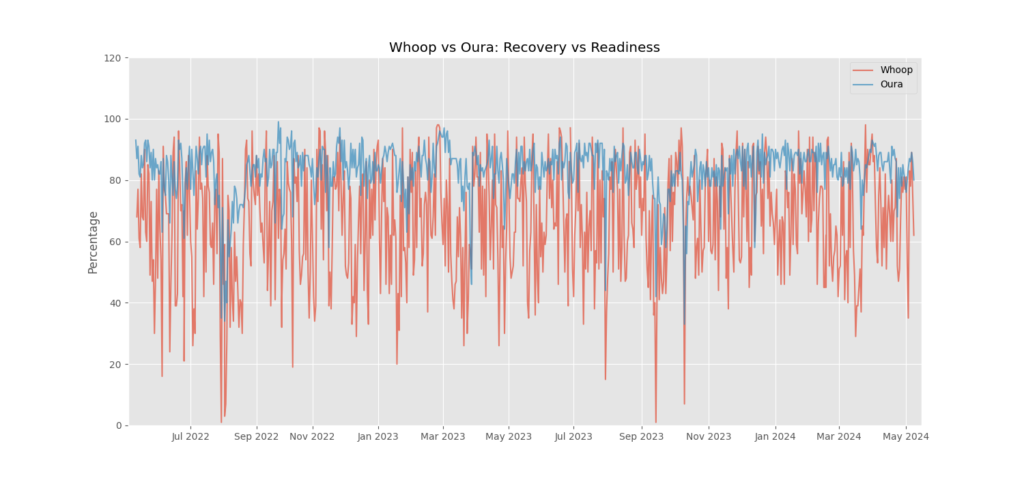
As covered in my Oura Gen 2 vs Gen 3 article, the new generation 3 ring is even more optimistic when it comes to Readiness, averaging a score 2.3 higher. After a bout of food poisoning my Whoop gave a recovery score of 43% while Oura’s Readiness score was still 78. Whoop gives more weight to HRV in their equation and so by dipping well below my average with an HRV of 49ms this is reflected in a low recovery score but not necessarily in Oura’s Readiness, which feels more tied to quality of sleep.
A combination of a fever and tooth infection the day after a heavy workout meant I was given a Whoop Recovery score of 1% for the first time in August 2022. This day was also the lowest Readiness score from Oura of 35.
Whoop vs Oura: Sleep Score
- Whoop Average Sleep Score: 85.6
- Oura Average Sleep Score: 82.5
- Correlation: r = 0.485

I found this graph the most interesting. They are generally well aligned but I deliberately changed my routine in early July 2022 and it’s very clearly reflected in the decoupling of the two scores.
On several episodes of the Whoop podcast they’ve mentioned how important sleep consistency is to quality of sleep (consistent sleep and wake times). By focusing on sleep consistency I found a bigger jump in Whoop sleep score compared to Oura sleep. It’s plausible that sleep consistency has a higher weight in the Whoop sleep score.
Whoop vs Oura: Total REM Sleep
- Whoop Average REM Sleep (mins): 124.2
- Oura Average REM Sleep (mins): 92.5
- Correlation: r = 0.445
- Oura Beta* Average REM Sleep (mins): 106.7
*Oura beta algorithm available Dec 2022 until June 2023 when it was released into production

Here’s where you start doubting the ability of a wearable to accurately measure sleep stages.
I watched an Oura review with a user who previously owned a Garmin, and he noted that his REM and Deep sleep durations appeared to “switch” with the Oura. That meant if his Garmin told him he got 2 hours of REM and 1 hour of Deep sleep, Oura would report roughly 2 hours of Deep sleep and 1 hour of REM.
A typical night of sleep should involve around 20-25% REM sleep and 13-23% Deep sleep. As my total sleep is around 7h30 per night that would equate to 90-112 minutes of REM sleep and 58-104 minutes of Deep sleep. While the average for Whoop REM sleep is 116.6 minutes, as can be seen on the graph it doesn’t actually fall within the 90-112 minute range too often, jumping from over 150 minutes to under 60 minutes quite frequently across the two months.
Oura released a Beta version of a sleep algorithm in early December 2022 and moved it into production in June 2023. It now reports far more REM sleep and far less deep sleep, aligning more closely with Whoop.
Whoop vs Oura: Total Deep Sleep
- Whoop Average Deep Sleep (mins): 102.1
- Oura Average Deep Sleep (mins): 113.9
- Correlation: r = 0.078
- Oura Beta Average Deep Sleep (mins): 106.7

As with the REM sleep graph, Deep sleep doesn’t appear to have good alignment between the two wearables.
There’s a ~10 day spell where Oura reports over 120 minutes every night and Whoop reports less than 120 minutes. Deep sleep is physically restorative and so demand should increase with exertion, but I don’t have the background knowledge to say whether Whoop or Oura data is more plausible.
The new Oura Beta algorithm for sleep now seems to report less deep sleep than Whoop. It’s attributing huge amounts to light sleep each night. Oura’s deep sleep also seems to trend upwards around September 2022 before the new algorithm release in June 2023.
If you’re interested in more in-depth comparisons I highly recommend The Quantified Scientist on YouTube. Here’s a clip from his channel comparing Oura Gen 3 sleep stage tracking to the gold standard
Whoop vs Oura: Sleep Efficiency
- Whoop Average Sleep Efficiency: 86.5%
- Oura Average Sleep Efficiency: 85.3%
- Correlation: r = 0.510

While the averages align well, there are clearly some days where there’s disagreement. The most obvious to me is mid-December 2022 when Whoop reported several days below 80% efficiency. I injured my foot in early December which is the only explanation I can give. Whoop was reporting a reduction in both Deep and REM sleep for the week I was rehabbing the injury. The majority of days the two wearables seem pretty well aligned.
Whoop vs Oura: Respiratory Rate
- Whoop Average Respiratory Rate (breaths per minute): 16.7
- Oura Average Respiratory Rate (breaths per minute): 15.4
- Correlation: r = 0.720
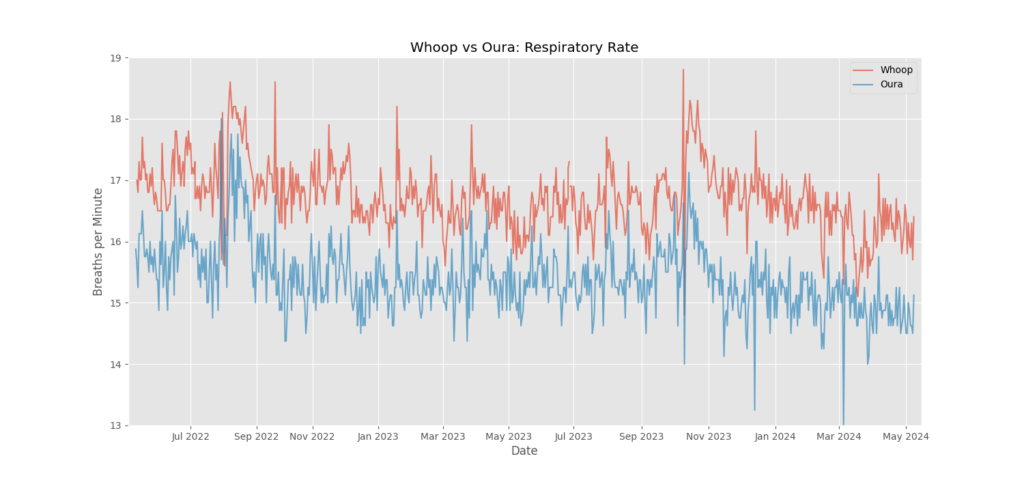
Last but not least is respiratory rate. I read Wim Hof’s book where he noted that a respiratory rate above 15 indicates stress. I also read Breath by James Nestor where a lower respiratory rate should be the goal for most people. This is something that generally stays within a small range, typically no more than +/- 1 breath per minute across a month. The important information to take is therefore when respiratory rate suddenly falls outside that range. I would say alignment is generally good, and for the purpose of identifying extremes it doesn’t really matter whether their averages differ, as each will consider it to be my respective baseline rate.
Anything I’ve missed? Leave a comment below. Thanks for reading and please feel free to bookmark it as I intend to update the graphs every 2-3 months with the latest data.