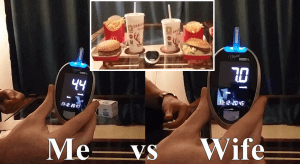
It was quite hard to find out blood glucose testing results for non-diabetics to know what a “normal” response is. I’ll share the video below and then talk you through the basics.
What is Blood Glucose?
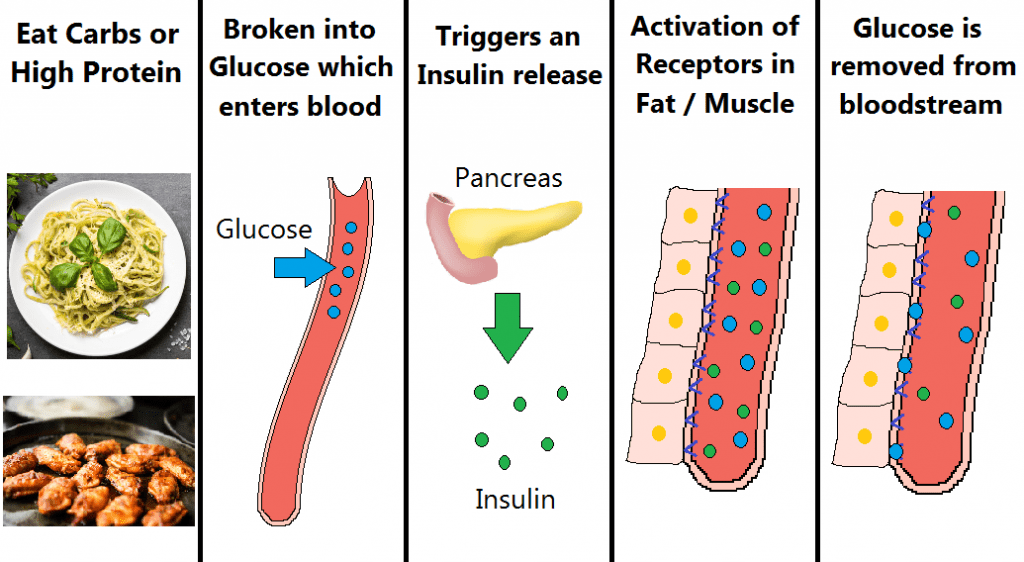
When you eat carbohydrates, or a large portion of protein, it gets broken down by the body into glucose, which then enters the bloodstream. Whether it’s pasta or a jam doughnut, it all ends up as glucose, just at different speeds.
The presence of glucose (above fasted levels) triggers the release of insulin from the pancreas. The insulin activates receptors in your muscle and fat cells, which transport the glucose out the bloodstream. Your body is trying to clear the excess glucose out your blood as fast as possible.
With the use of a Glucose meter, such as the GlucoRX Nexus that we used, you can test your blood glucose levels. There are two things you’re interested in: Fasted Glucose and Post-Prandial Glucose Response (PPGR).
Fasted Glucose – What’s “Normal”?
The official definition of fasted tends to be 8 hours without eating, but for the average person those readings should be similar to measuring 4+ hours after your last meal.
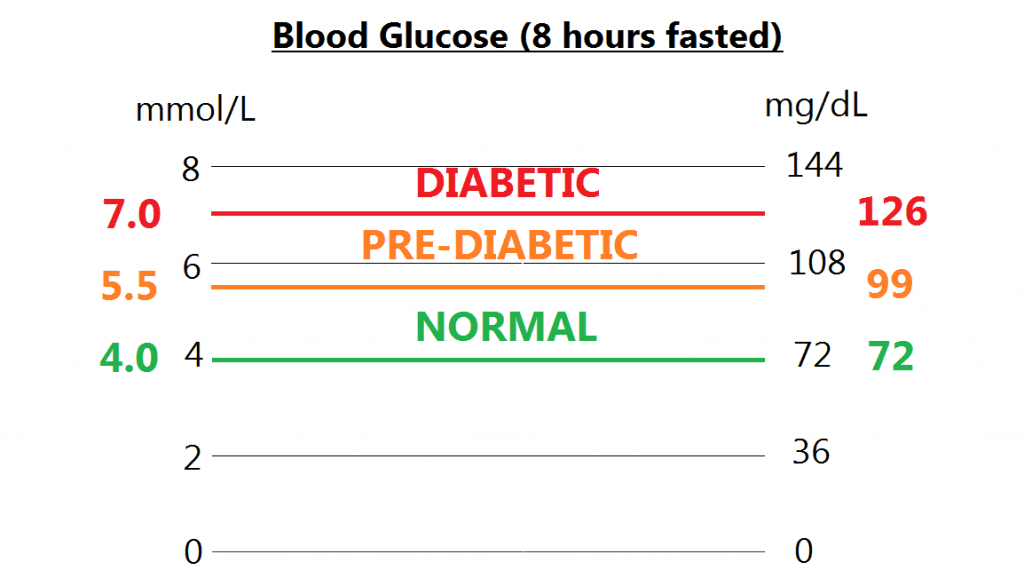
The UK tends to work in units of mmol/L, while the US uses mg/dL. With the former a healthy fasted range is between 4.0 and 5.5 mmol/L, though some will state up to 6.0 is normal. Higher than that but below 7.0 is defined as pre-diabetic, a sort of glucose purgatory where the doctor might suggest exercise and dietary interventions. Fasted glucose of 7.0 mmol/L or above is defined as diabetic, though I believe multiple tests are administered to confirm. You can see the corresponding mg/dL values above.
Post-Prandial Glucose Response
This is a fancy way of saying “what your blood sugar levels do during and after a meal“. There will likely be a rise, a peak, and a drop to your normal levels. The height of the peak and the time taken to come back down are both indicators of your overall health. For healthy individuals, blood glucose should peak 30-60 minutes after a meal and come back down below 7.8 mmol/L (140 mg/dL) within 2 hours. A glucose tolerance test (fasting, followed by ingestion of a sugary drink) often tests at 2 hours, because that’s how long it takes for values to peak in diabetic individuals.
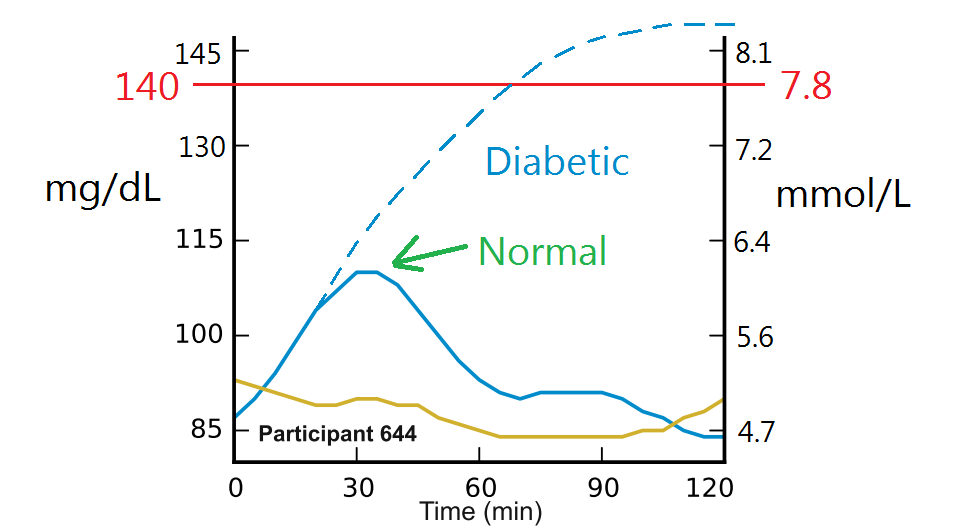
The chart above isn’t technically accurate, because the fasted levels will already be above 7.0 for a diabetic (note that all this is regarding Type II diabetes). The consensus online was that any food which holds you above 7.8mmol/L for an extended period of time should be avoided, even if you’re healthy.
What did we test, and why?
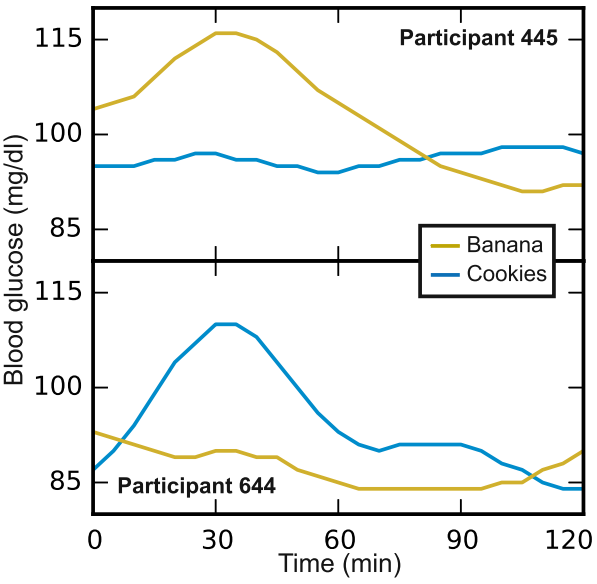
I was fascinated by a 2015 research paper which took 800 participants and measured their response to a variety of different foods. Among the findings were that, regardless of someone’s health status, certain foods produce a markedly different response between one person and another. The example given is with a Banana and a portion of Cookies, where some participants blood sugar spiked with one and not the other.
The goal of the paper was to predict a blood glucose response based on several variables. They found that high fibre the day before, adequate sleep, lower carbohydrate and lower GI (glycaemic index) of foods all led to a smaller response. What my partner and I were interested in, initially at least, was if there were any trigger foods that would illicit an above average response from us.
Meal Testing
Having familiarised myself with the variables, we set about a structured plan to test our meals. While generally reliable, the GlucoRX Nexus can be out by as much as 0.8mmol/L in a single reading, so for the more important values (30 mins after eating) we took two tests and used the average. I also insisted we stay seated until the final test was taken, and fast for at least 3 hours prior to our test meal.
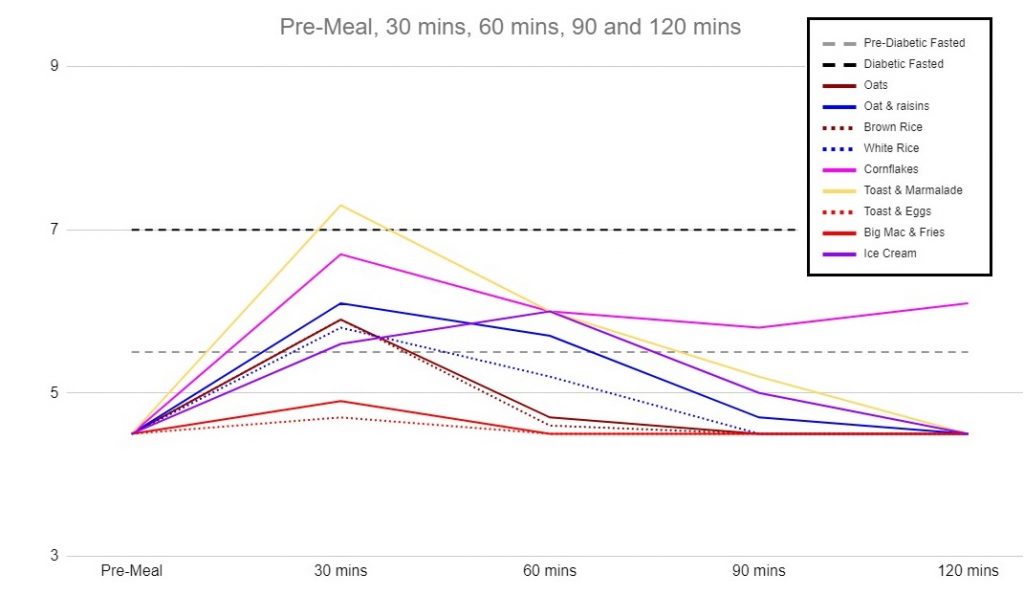
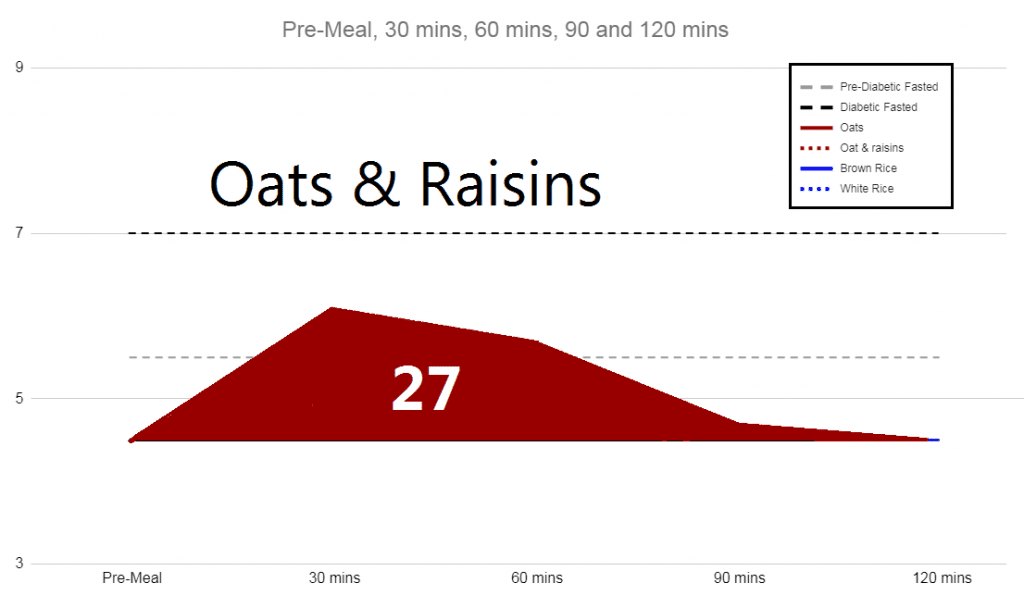
It’s a little cluttered, but there was a general trend to peak after 30 minutes (I did test one meal at 15 mins and 45 mins to confirm it isn’t peaking at another point). I also returned to normal by 2 hours (upon testing within 0.6mmol/L of baseline the assumption was that baseline would be reached in the next 30 mins). My highest spike was from 3 pieces of toast with marmalade, followed by a large bowl of cornflakes, then oatmeal with raisins. Ben & Jerry’s Ice Cream was the only food to see a peak at 60 minutes.
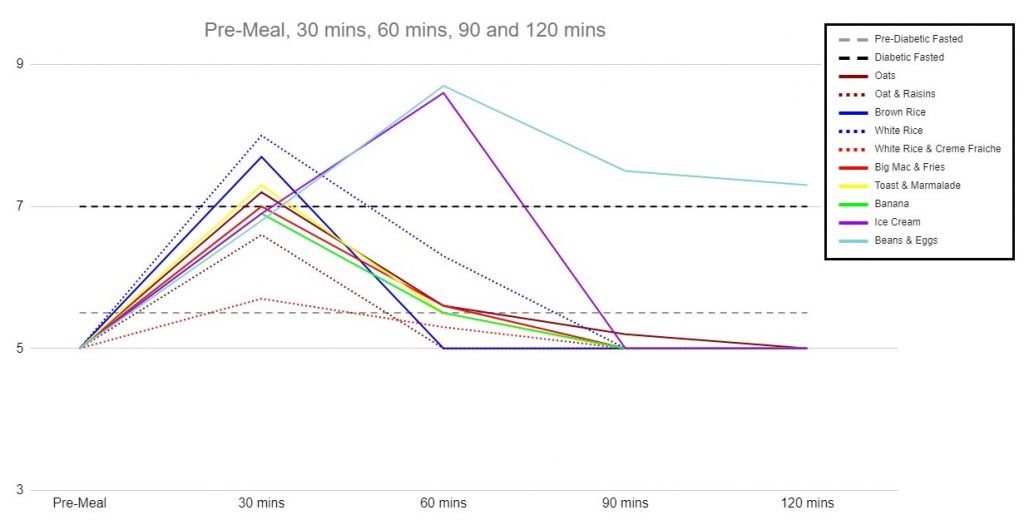
My wife generally peaked higher, reaching 7.5-8.0 for simple foods like Brown or White Rice with Chicken, and two later peaks for Baked Beans & Eggs, and for the Ice Cream (a 200ml serving vs. my 300ml serving). Her response to Ice Cream and to Baked Beans* was very large.
*Pending an update but the extreme reaction to baked beans was likely caused by monthly hormone changes, so will be re-tested
Glycaemic Load and AUC
The peak is only half the story, and how long your blood glucose takes to return to normal should also be a consideration. The way this is assessed is by calculating the Area Under the Curve (AUC), as demonstrated below. The units are less important than the relative values, but it’s converted into the US units and based on mg/dL.hours. If your glucose instantly went up by 20mg/dL for an hour and then came vertically down, that would be a score of 20.
We calculated each of these values and also looked at Glycaemic Load. That takes into account the Glycaemic Index of the food, but also it’s grams of available carbohydrate, also known as net carbs (carbs – fibre). The literature indicated that this was one of the best correlations you’re likely to find, and so I plotted our data points in matplotlib and drew a line of best fit*.
*the research paper indicated that the presence of fat in a ratio of 10g carbs: 4g fat was sufficient to blunt the glycaemic response.
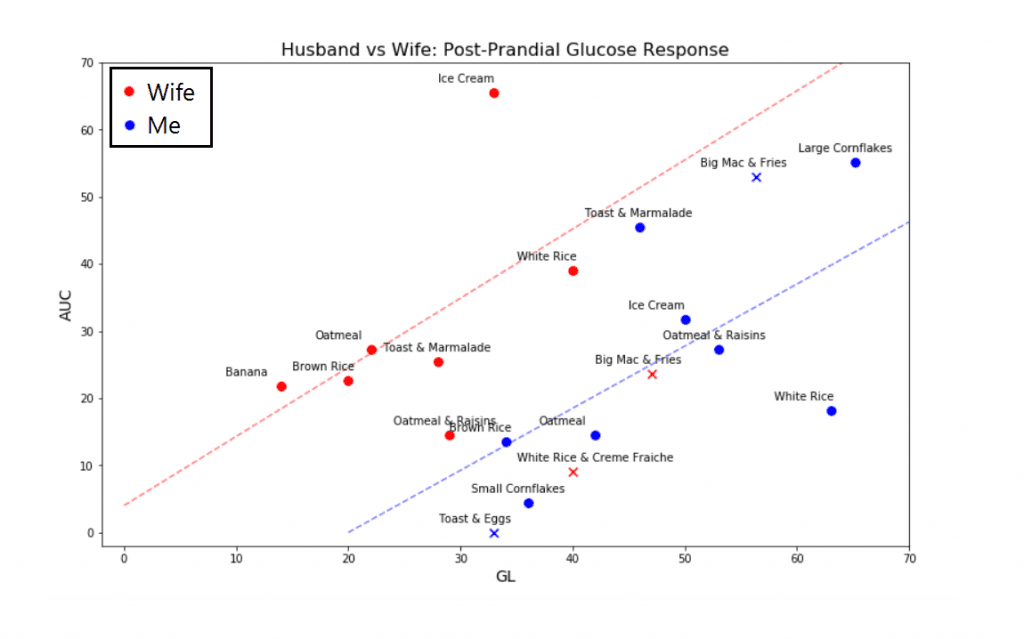
Glycaemic Load technically changes with the introduction of other foods, but for these purposes I simply added up the glycaemic load of the individual components of the meal and reported that value. Meals which met the threshold for the carb: fat ratio are represented by an “X”.
Key Takeaways:
- For a given Glycaemic Load, my AUC is lower, which makes sense given I have higher muscle mass and exercise frequently.
- The lines of best fit are almost parallel, meaning our response to an increase in GL is similar.
- Meals containing sufficient fat did show the potential to blunt our response, though the drops seen with the inclusion of eggs and creme fraiche were not seen in the high fat McDonald’s.
- A research paper showed that for non-diabetics, even those who are overweight, there was no difference in health markers to eating a high vs low GI diet, where nutritional value was kept the same. That being said, for diabetics the higher AUC’s seen with Ice Cream, McDonald’s, or Toast & Marmalade, are best avoided.
- On Chris Kresser’s website he suggests healthy values as Fasting (< 4.8), 1 hour Post-meal (< 7.8) and 2 hours Post-meal (< 6.6).
Conclusion
This was a really useful insight into the response our body has to different meals. It’s only the beginning of our self experimentation and we will look to test a further 10-15 meals each to build a better overall picture. What’s clear is that meals low in fat, those often branded “healthy” in food advertising, are the most dangerous for blood glucose.
The research paper also found that roughly 1 in 20 people were “carb insensitive”, that is to say their line of best fit was very flat, and their AUC did not increase as carb portion size was made larger.
The meter was only £14 and test strips the same again, so it was a reasonable price to pay for information that will dictate our food choices from now on.
I hope you enjoyed reading, if you have any comments please post them below.