I’ve always had an interest in tracking performance over time so this project really excites me. I sat down and went through a huge list of fitness tests to see what I could repeat every summer. Having reached 35 years old, every source is telling me to expect an imminent physical decline. I am ready to put that to the test.
The Tests
I’m not naïve enough to think I can select the perfect battery of test at the first attempt, so this will evolve over time. I included a wide range of tests covering physical fitness, strength, mental ability and general health. Here’s the list in full:
- Body Weight
- Body Fat %
- FFMI (from Year 3)
- Waist Measurement
- Blood Pressure
- Peak Flow
Fasted Blood Glucose(Year 1)- Blood Test – HbA1c
- Blood Test – CRP (from Year 3)
- Blood Test- Apo B (from Year 3)
- Resting Heart Rate
- Breath Hold (in)
- Breath Hold (out) (from Year 3)
- Dead Hang for Time
- Front Plank for Time
Fingertip to Floor Distance(Year 1)- VO2max Step Test
VO2max Bleep Test(Year 1)- VO2max Cooper Test (from Year 2)
- VO2max 2km row (wife only)
- VO2max Rockport Walk (from Year 2)
- Grip Strength
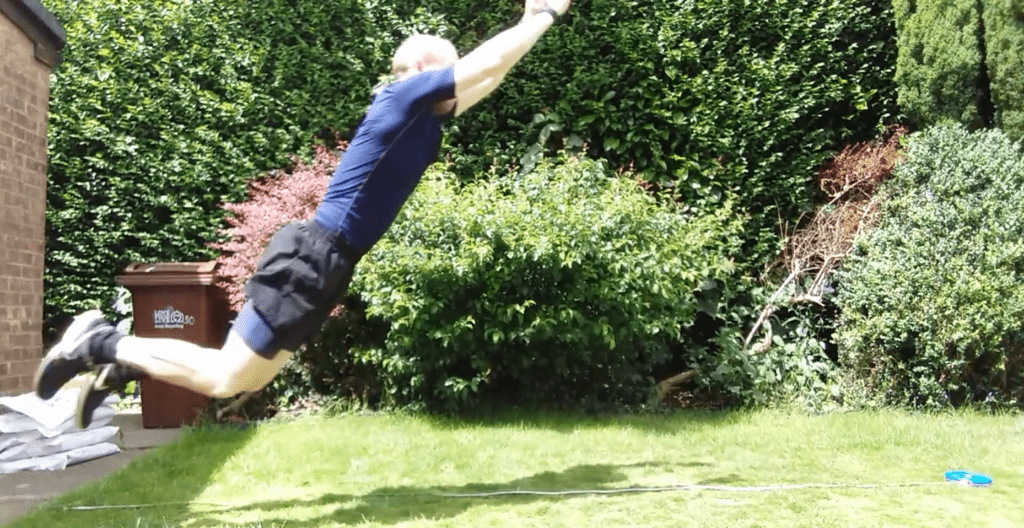
- Standing Vertical Jump
- Standing Broad Jump
- Maximum Push Ups (Tempo)
- Maximum Pull ups (Tempo)
- Flexed Arm Hang for Time (wife only)
Mensa IQ Test(Year 1)- Quantified Mind IQ Version 3
These can be subdivided into various categories, and that’s how I’ll take you through the baseline results.
General Health
For general health I’m including the first seven tests:
- Body Weight – measured using my Tanita BC-543 scales
- Body Fat % – measured using my Tanita BC-543 scales
- Fat Free Mass Index – calculated based on numbers derived from my Tanita BC-543 scales
- Waist Measurement – tape measure, level with the belly button
- Blood Pressure – measured using my Omron M2 Basic Blood Pressure monitor
- Peak Flow – measured using my Mini-Wright Peak Flow Meter
- Fasted Blood Glucose – measured using my GlucoRx Nexus Blood Glucose Meter
- Blood Test (HbA1c, CRP, Apo B) – measured using an at-home blood test
Body Weight
Starting with a simple one – my weight. Following University (2005-2010) I was keeping fit by playing rugby, where it helps to be a bit heavier. More recently (2022 onwards) I’ve taken up sprinting again and I consciously keep my weight down, so this year I was under 70kg.
I’m very disciplined in the way that I count calories and regularly weigh myself, which means I feel almost in complete control of what direction my weight moves.
Waist Measurement
Waist measurements tend to follow a similar pattern to weight. It’s an indication of the level of unhealthy visceral fat around your internal organs, so it’s a simple and important one to track.
Fat Free Mass Index
I learned about Fat Free Mass Index (FFMI) from a health podcast. It’s similar to BMI, which is weight in kg / (height in metres)², but instead of total weight in the numerator, you use fat-free weight.
In 2024 I was 70.2kg and 16.5% body fat, at a height of 1.76m. If I’m 16.5% fat, I’m 83.5% fat free, and 83.5% of 70.2kg is 58.617kg. Taking 58.617kg / (1.76)² gives 18.92, which is my FFMI. While I only introduced this in 2024, it’s a calculation based on numbers I have available from previous years, so I can backfill the values.
While I’m not concerned about the downward trend here, as I’m also losing overall body-weight at the same time, I will make more of an effort to add muscle mass for 2025.
Blood Pressure
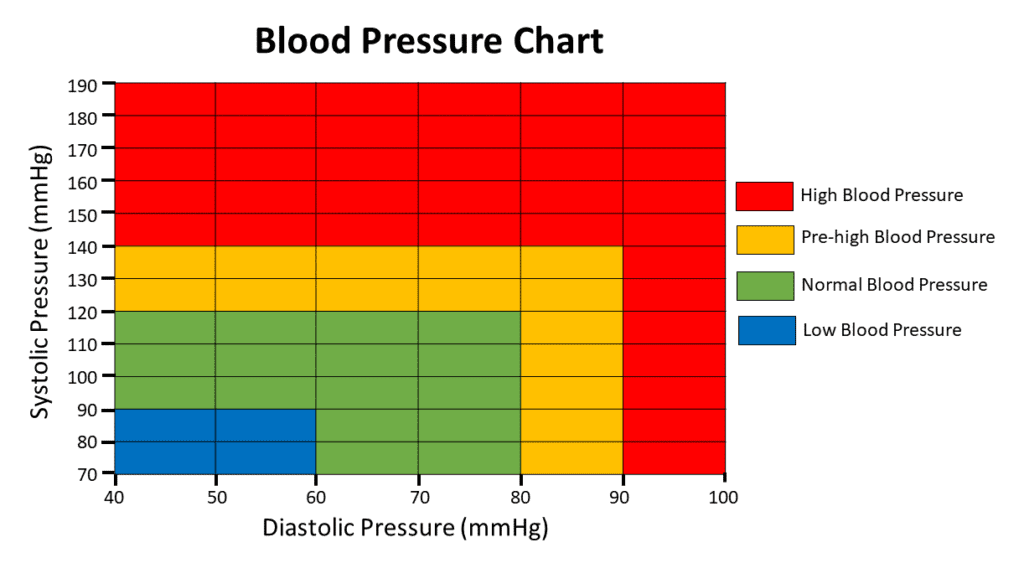
For blood pressure I sit down in a chair for at least 5 minutes and take a reading on both arms. Using an Omron M2 Basic, the sleeve is applied as instructed and with a simple press of a button it whirrs into action and takes a reading. The first number (systolic pressure) should ideally be between 90 and 120, and the second number (diastolic pressure) between 60 and 80.
You may be more familiar with blood pressure as displayed in the below chart. Blood pressure is a pair of numbers every adult should know about themselves.
Peak Flow
Peak Flow is a basic test of lung function you may have been asked to do at the GP. The test involves taking a deep breath in and blowing air through a tube as fast as you can, with the result in Litres per minute. It’s helpful in identifying people with compromised breathing, which varies based on age, sex and height.
My values are comfortably above the norms for my age, sex and height. See the below chart to understand where you should sit. If you wish to measure this, a Mini-Wright Peak Flow Meter costs around £10.

HbA1c Blood Test
HbA1c is useful in the diagnosis of type 2 diabetes. It’s roughly equivalent to a 3 month snapshot of your average blood glucose levels and ideally you’re trying to stay between 31 and 37 mmol/mol (5.0 to 5.5%).
Despite having what I would consider to be a healthy diet, and regular exercise, mine is on the high end of normal and possibly trending up since 2019.
hs-CRP Blood Test
High Sensitive C-Reactive Protein, abbreviated hs-CRP, is a marker of inflammation. Chronic inflammation is closely tied to the ageing process, so much so that people use the term “inflammaging”. I’ve highlighted the optimal range here, which is less than 1.0 mg/L.
Apolipoprotein B Blood Test
For cholesterol, many people are familiar with LDL cholesterol. The marker I’m really interested in is called Apolipoprotein B, or Apo B for short. LDL and Apo B correlate quite well, but when one is high and the other is low, it’s Apo B that is the best predictor of cardiovascular risk.
I’m a regular listener of Dr Peter Attia’s podcast and he strongly encourages the tracking of Apo B. His optimal range is more aggressive than other physicians, aiming for below 0.62 g/L. Until I learn more I’m happy staying under 1.
Fitness
The measurements and tests for fitness are as follows:
- Resting Heart Rate
- VO2max Rockport Walk
- VO2max Step Test
- VO2max Cooper Test
- Breath Hold (in)
- Breath Hold (out)
- Dead Hang for Time
- Front Plank for Time
Resting Heart Rate
For this test I’ve been using two different protocols. One is to take my heart rate at the time of my blood pressure, which is following 5 minutes sitting still. The second is to measure my pulse first thing upon waking, before getting out of bed. As the latter is in a prone position, the values will be lower.
VO2 max testing
The Rockport Walk test is a really nice introduction to submaximal VO2 max testing. It requires a one mile walk, and the only equipment you need is a stopwatch. Another submaximal test is the Queen’s College Step test, which is a 3 minute test involving a 40cm step.
In terms of maximal tests, I often choose the Cooper test. Note that I am most comfortable with running as exercise, and there alternative tests for cyclists (Astrand-Rhyming) or rowers (2km Row test).
As you can see, different tests can give different results. I was never really motivated to do the Bleep test which is likely why my scores were consistently lower, while I believe the Home Step test is overestimating. For the most accurate results, it may be better to try multiple tests and take an average.
Breath Hold (in)
I’m sure I won’t be the only person who didn’t know that holding your breath on the “out” i.e. with empty lungs, is a legitimate test. It’s a measure of something called CO2 tolerance, which is an indication of how efficiently you breathe day to day, as well as your aerobic capacity. I only learned about this in 2024 which was the first year I measured it.
The more traditional “in” breath measures different qualities like the ability to store and utilise oxygen, and overall lung capacity. , which should actually be done with about 75-80% full lungs rather than taking in as much air as you can. If you are scoring under 30 seconds that’s considered “poor” and could be an indication of chronic obstructive pulmonary disease (COPD).
Dead Hang (maximum time)
A dead hang involves hanging from a bar with only your hands, traditionally in an overhand grip, and measures grip endurance. The timer starts when you leave the floor and stops when you next make contact with it.
I was quite pleased with myself but I’ve since read Outlive by Peter Attia, where he encourages his male patients to strive for a 2 minute dead hang. This is something I very nearly achieved after following Ido Portal’s 30 day hanging challenge.
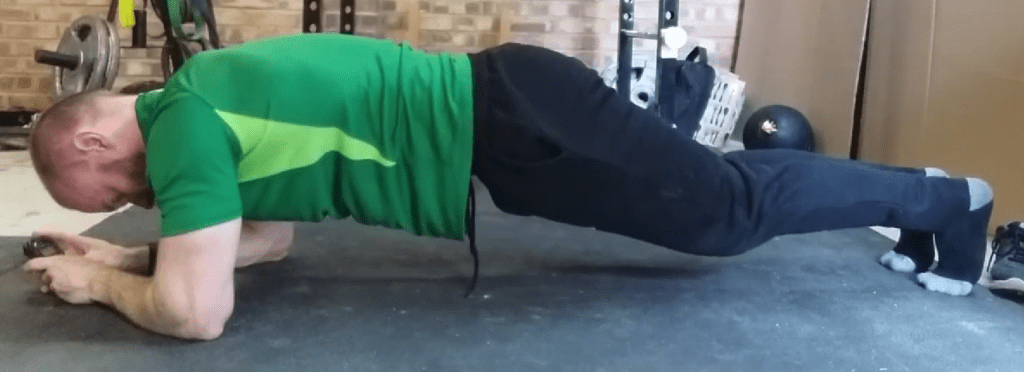
Front Plank (maximum time)
The front plank was chosen for general endurance and was one of several I picked from the list of tests on Top End Sports. It includes a scoring system, with 6 minutes required to be considered “Excellent”.

Rather than complete failure, I stopped the timer when technique was faltering. The main focus was on ensuring a straight line from heel to shoulder and not sagging at the hips.
Strength and Power
This website is called 9to5strength and not 9to5fitness for a reason – I love this type of training. I was pretty confident that the exercises I chose here offered a good overall assessment of strength and power. There was a temptation to include some sort of 1 to 3 rep max lifting weights, but for the high injury risk these were avoided. Here are the tests I chose:
- Grip Strength
- Standing Vertical Jump
- Standing Broad Jump
- Maximum Push Ups (Tempo)
- Maximum Pull ups (Tempo)
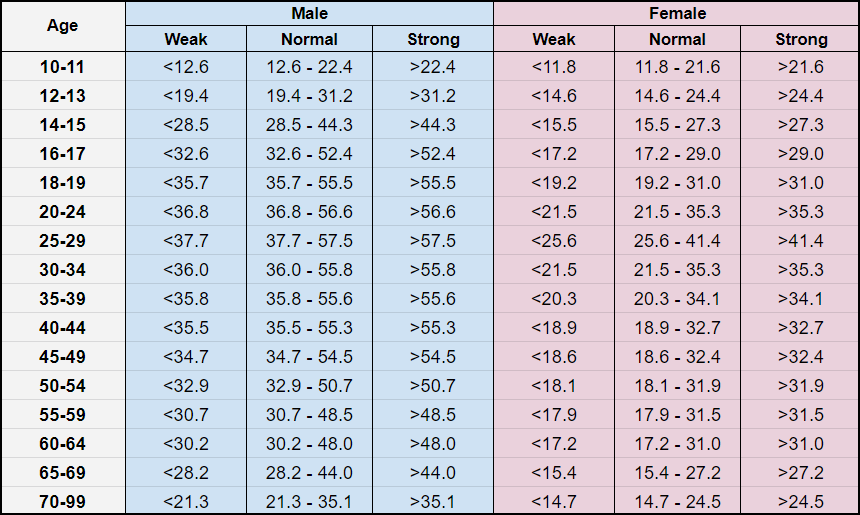
Grip Strength
This is one that’s often linked to overall longevity and important for the elderly. I have a Camry Hand Grip Dynamometer and I’ve used it in several experiments. It’s as easy as turning it on and giving the handle a good squeeze for 3 to 5 seconds. I tested three times on each hand and took the highest score.
I enjoy testing grip strength so much I replicated one of the normative value charts for grip strength, which I’ve added below.
Standing Vertical Jump
For the vertical jump I like the “tip to tip” method, see my separate article on how to measure your vertical jump. Tests like these require a dynamic warm up, and again a best of three is a nice approach. This is a great measure of lower body power, and there’s no getting around the influence that body-weight has on your jump height.
I’ve always been more of a power athlete, but my height (176cm / 5’9″) doesn’t lead itself to impressive jump heights.
Standing Broad Jump
The broad jump is another maximal test that requires a thorough warm up. Remember you’re measuring the back of your foot when it lands, not the toe. Both this and the standing vertical jump are testing lower body power, so it’s perfectly acceptable to only track one of them.

The training I do in the gym is directly impacting my broad jump ability. This is one which I will be working hard to maintain as I enter my 40’s and 50’s.
Maximum Push Ups (Tempo)
The push up test has several variations and I initially chose one with a time limit. Later on, having listened to a podcast series with Dr Andy Galpin, I switched to measuring with a set tempo. Here I set a metronome to 50 beats per minute, and I stop when I can no longer hold that tempo.

If you’re interested in push up standards for men and women they’re widely available online. You might notice the dramatic increase from 2023, which is due to following a 7 week push up program, shown below.
Maximum Pull ups (Tempo)
The final strength test I included was consecutive pull ups. It’s different enough from push ups that I wanted to include both. I made sure that my technique was solid by pausing at full arm extension. The cue I used was to pause long enough that someone could take a picture of me without it coming out blurry. This was set to 30 beats per minute, meaning only 15 pull ups per minute. This is deceptive as it feels very slow at first, but ends up being the limiting factor as you rush the final reps.

Unlike my push ups, I wasn’t able to maintain the improvements from a dedicated pull up program by the time I did my annual testing. Having got all the way up to 25 reps I was back down to 14 reps by the summer.
Cognitive Ability
Quantified Mind IQ Version 3
In the first year I took an at-home Mensa IQ test, but later realised I would be repeating the exact same questions in future years so it wasn’t a good option.
A free alternative was a website I’d been familiar with for a few years called Quantified Mind. They have a battery of tests called IQ version 3, which involves 11 different tests assessing a range of different mental attributes.

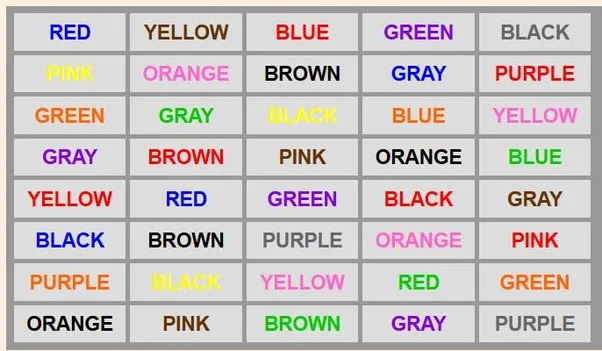
I take the average but also track each individual score, as they are testing different things. An example test is the Stroop test, which you may be familiar with (pictured below). You are shown a coloured word and you press a button that either corresponds to the colour it spells, or the actual colour of the letters.
Final Word
As you can see, it’s a comprehensive set of tests that should pick up any physical or mental decline with age. The majority of them can be done with either free or inexpensive equipment across a single weekend. If you want to have a go at completing these tests please check out this spreadsheet. I’d love for people to try them out, especially if you plan to do it every year!