
I’ve always had an interest in tracking performance over time so this project really excites me.
Having reached 35 years old, every source is telling me to expect an imminent physical decline. I am ready to put that to the test.
I sat down and went through a huge list of fitness tests to see what I could repeat every summer.
The Tests (updated July 2026)
I’m not naïve enough to think I can select the perfect battery of tests at the first attempt, so this will evolve over time. I included a wide range of tests covering physical fitness, strength, cognitive function and general health. Here’s the list in full:
- Body Weight
- Body Fat %
- FFMI (from Year 3)
- Waist Measurement
- Waist to Height Ratio
- Blood Pressure
- Peak Flow
- FEV1 (from Year 4)
Fasted Blood Glucose(Year 1)- Blood Test – HbA1c
- Blood Test – CRP (from Year 3)
- Blood Test- Apo B (from Year 3)
- Resting Heart Rate
- Breath Hold (in)
- Breath Hold (out) (from Year 3)
Dead Hang for Time(Year 1-5)
Fingertip to Floor Distance(Year 1)- Front Plank for Time
- VO2max Step Test
VO2max Bleep Test(Year 1)- VO2max Cooper Test (from Year 2)
VO2max 2km row(Year 1-2)- VO2max Rockport Walk (from Year 2)
- VO2max Åstrand-Ryhming (from Year 5)
- Grip Strength
- Standing Vertical Jump
- Standing Broad Jump
- Maximum Push Ups (Tempo)
- Maximum Pull ups (Tempo)
Mensa IQ Test(Year 1)- Quantified Mind IQ Version 3
These can be subdivided into various categories, and that’s how I’ll take you through the baseline results.
General Health
For general health I’m including the first eleven tests:
- Body Weight – measured using my Hume Health Body Pod
- Body Fat % – measured using my Hume Health Body Pod
- Fat Free Mass Index – calculated from Body Weight and Body Fat %
- Waist Measurement – tape measure, level with the belly button
- Waist to Height Ratio – calculated from height and waist measurement
- Blood Pressure – measured using my Omron M2 Basic Blood Pressure monitor
- Peak Flow – measured using my Mini-Wright Peak Flow Meter
- FEV1 – measured using my Contec SP70B Spirometer
- Blood Test (HbA1c, CRP, Apo B) – measured using a Thriva at-home blood test
Note: Affiliate links included here
Body Weight
Let’s start with a simple one – my weight. Following University (age 27-32) I was keeping fit by playing rugby, where it helps to be a bit heavier. More recently (age 35 onwards) I’ve taken up sprinting again and I consciously keep my weight down.
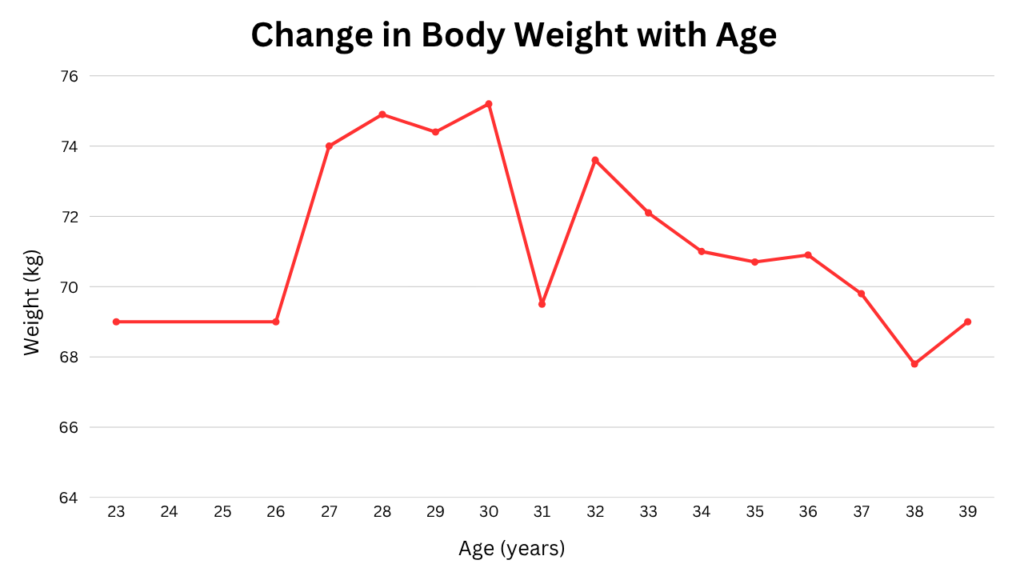
I’m very disciplined in the way I count calories and regularly weigh myself, which means I feel almost in complete control of what direction my weight moves.
Body Fat & Fat Free Mass Index
I learned about Fat Free Mass Index (FFMI) from a health podcast. It’s similar to BMI, which is weight in kg / (height in metres)², but instead of total weight in the numerator, you use fat-free weight.
While I only introduced this at age 37, it’s a calculation based on numbers I have available from previous years, so I can backfill the values.
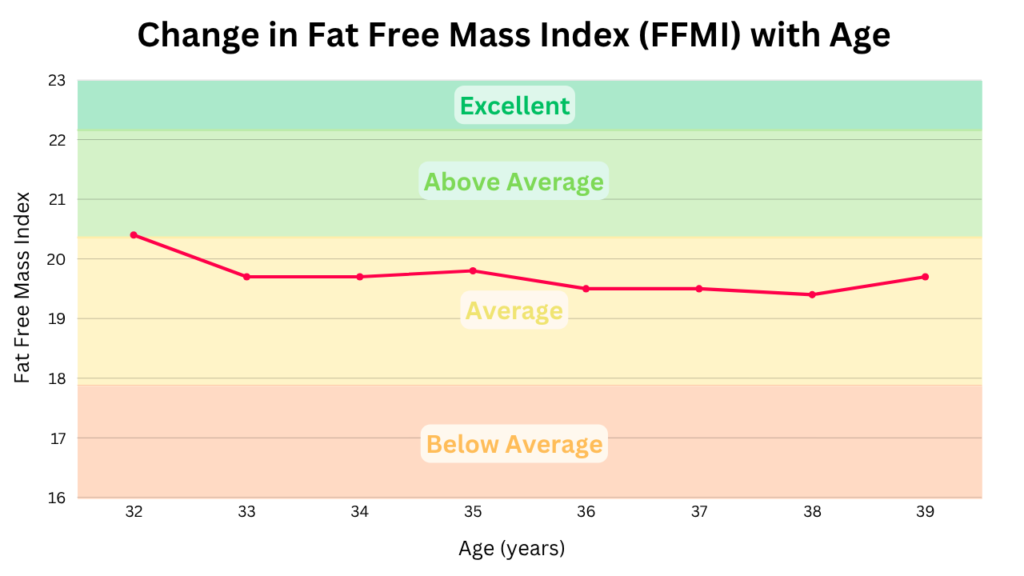
There was a downward trend from age 32 in parallel with a reduction in overall body-weight. Over the last 12 months I’ve made a conscious effort to put on lean mass.
Waist & Waist to Height ratio
My waist measurement tends to follow a similar pattern to weight. An additional calculated field is waist to height ratio. This is an indication of the level of unhealthy visceral fat around your internal organs, and it’s a simple and important one to track [1].
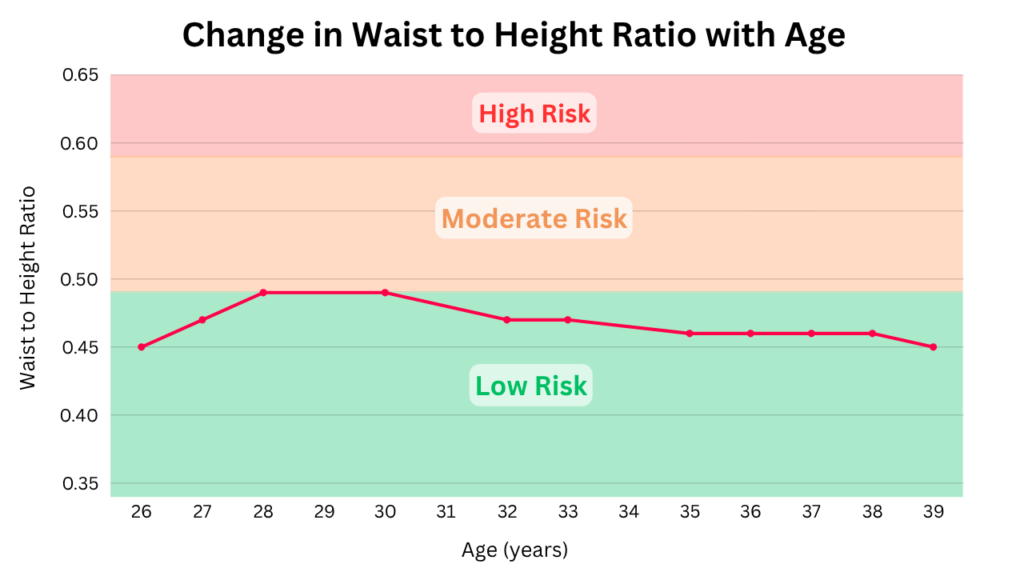
I was surprised to see that in my late 20’s my waist circumference of 86cm (34 inches) was borderline moderate risk. The “risk” it refers to is conditions like high cholesterol, high blood pressure and type 2 diabetes.
Blood Pressure
I take my blood pressure with an Omron M2 Basic and use the average of two readings per arm. It’s important to measure because elevated blood pressure, known as hypertension, can occur without symptoms.
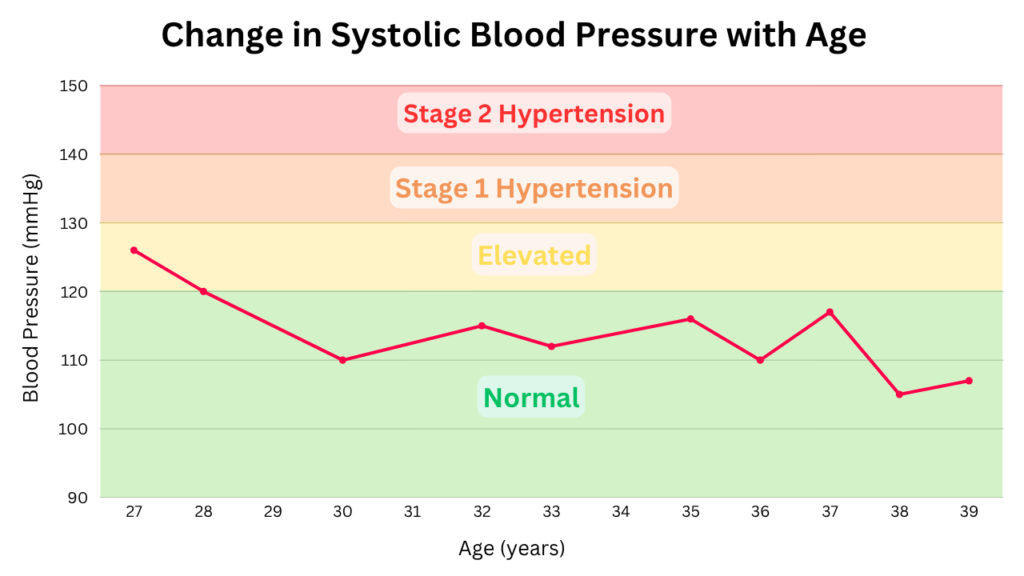
In my late 20’s, when I was 5-6kg heavier than I am now, I was oblivious to my elevated systolic blood pressure.
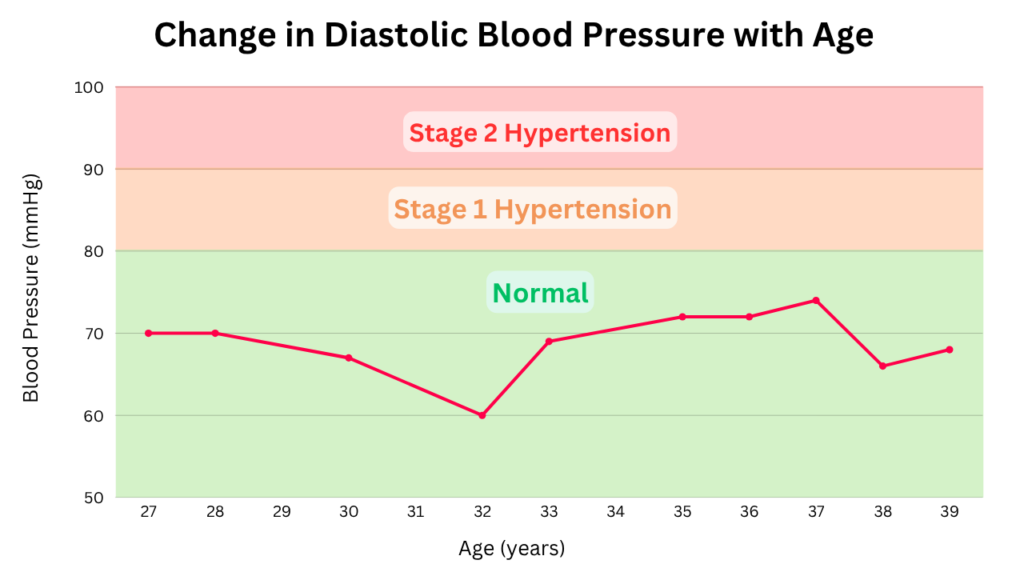
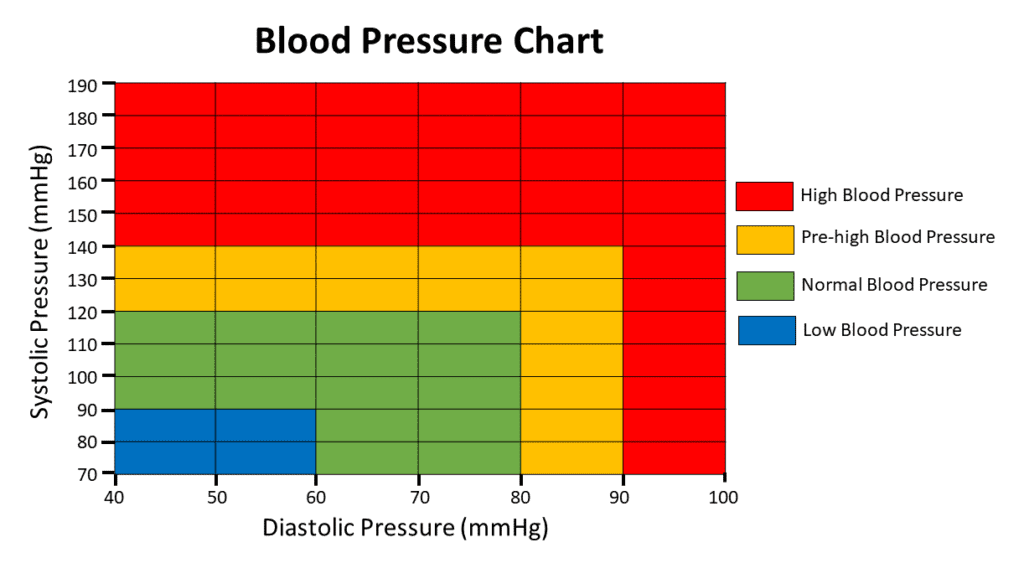
My diastolic blood pressure has always been normal, but assessments are based on both systolic and diastolic figures. You may be more familiar with blood pressure as displayed in the below chart.
Peak Flow and FEV1
Peak Flow is a basic test of lung function you may have been asked to do at the GP. The test involves taking a deep breath in and blowing air through a tube as fast as you can. It’s helpful in identifying people with compromised breathing that may indicate COPD*, which varies based on age, sex and height.
*COPD is the name given to several conditions that restrict breathing, including emphysema and bronchitis
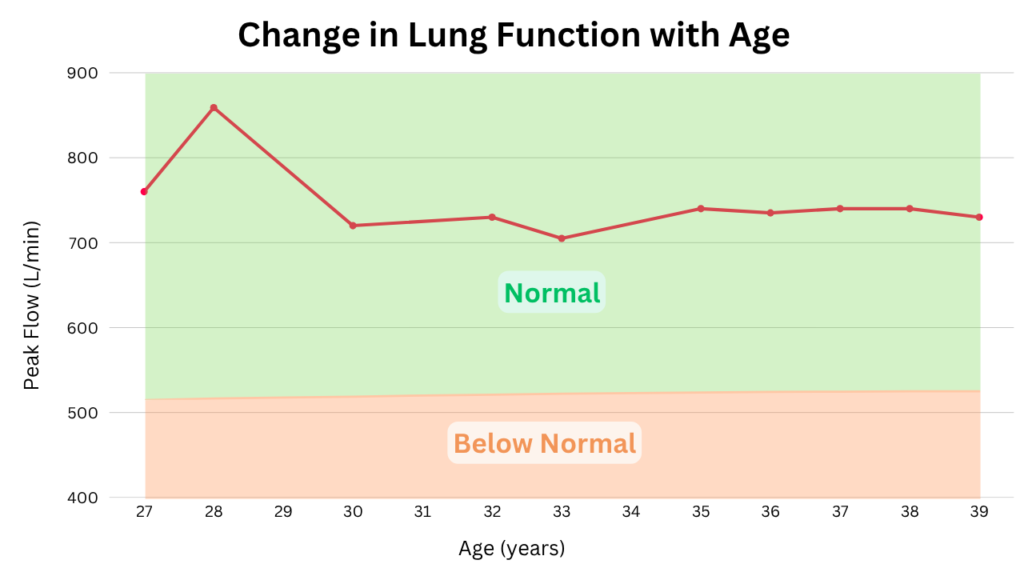
My peak flow values are comfortably above the norms for my age, sex and height. See the below chart to understand where you should sit.

Beyond that is a measure called FEV1. This has been shown in research papers to correlate with longevity. Here FEV stands for Forced Expiratory Volume. This is how much air you can exhale, and the “1” indicates it’s how much you can exhale in one second.
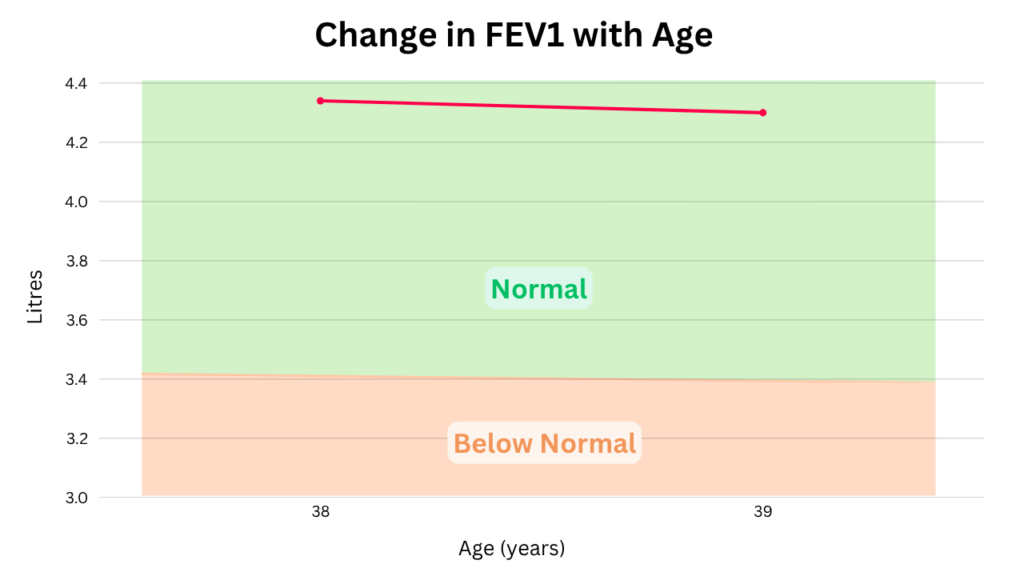
I have previously used a Powerbreathe device to improve my lung function, but as it trains the inhale (inspiratory muscles) it may not have any carryover to these exhale-based metrics.
HbA1c Blood Test
HbA1c is useful in the diagnosis of type 2 diabetes. It’s roughly equivalent to a 3 month snapshot of your average blood glucose levels and ideally you’re trying to stay between 26 and 37 mmol/mol (4.5 to 5.5%).
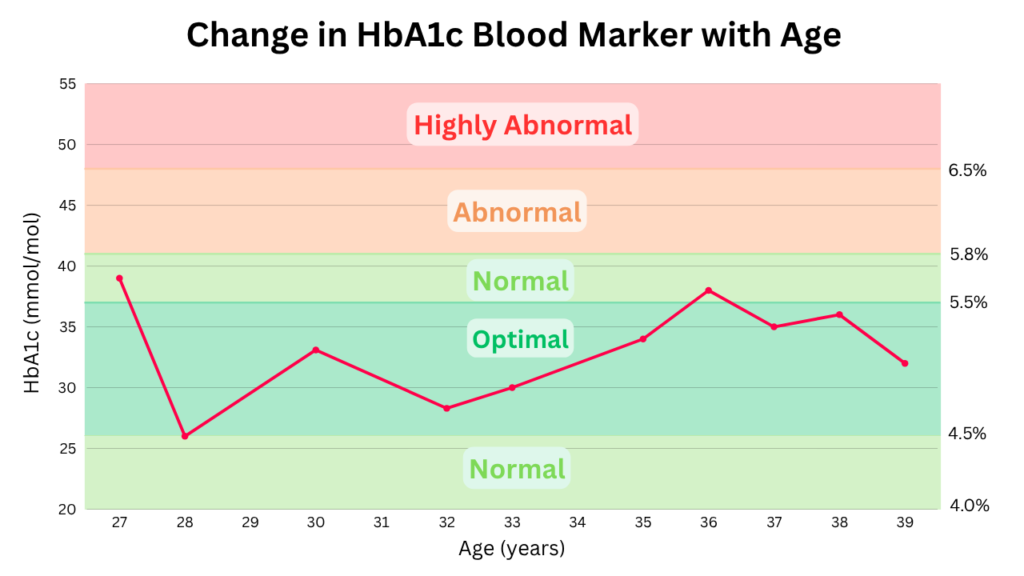
Despite having what I would consider to be a healthy diet and regular exercise, my HbA1c had been trending up since age 32. By introducing short walks after meals, my most recent value is back in the middle of the optimal range.
hs-CRP Blood Test
High sensitivity C-reactive protein, abbreviated hs-CRP, is a marker of inflammation. Chronic inflammation is closely tied to the ageing process, so much so that people use the term “inflammaging”.
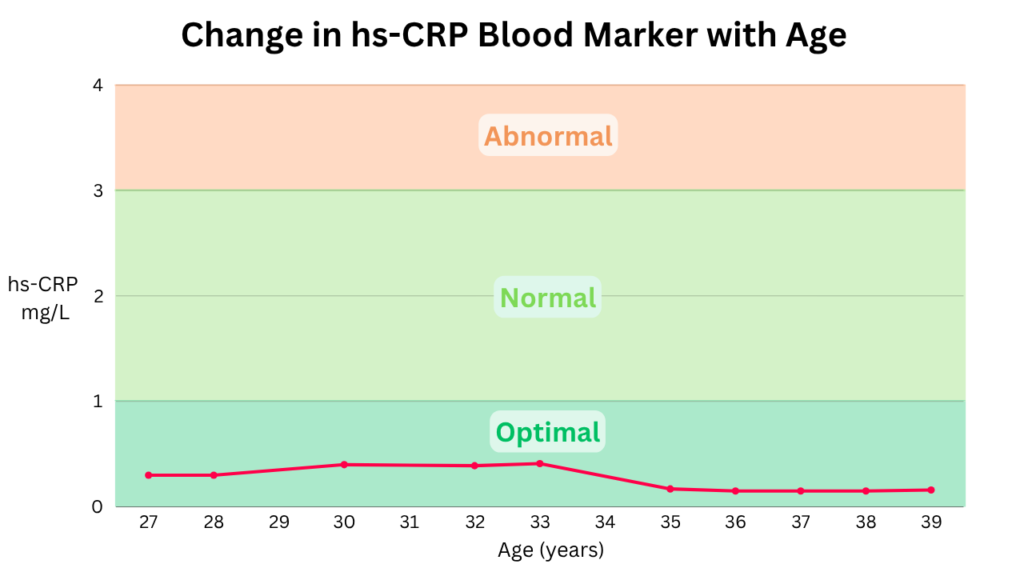
There is a strong correlation between hs-CRP and body mass index [2], with obese individuals having a mean hs-CRP above 3.0 mg/L. I believe a health body-weight and regular exercise has kept me in the optimal range, below 1.0 mg/L.
LDL Cholesterol / Apo B Blood Test
For cholesterol, many people are familiar with LDL cholesterol. However, the heart health marker clinicians are most interested in is called Apolipoprotein B, or Apo B for short. LDL and Apo B correlate quite well, but when one is high and the other is low, it’s Apo B that is the best predictor of cardiovascular risk.
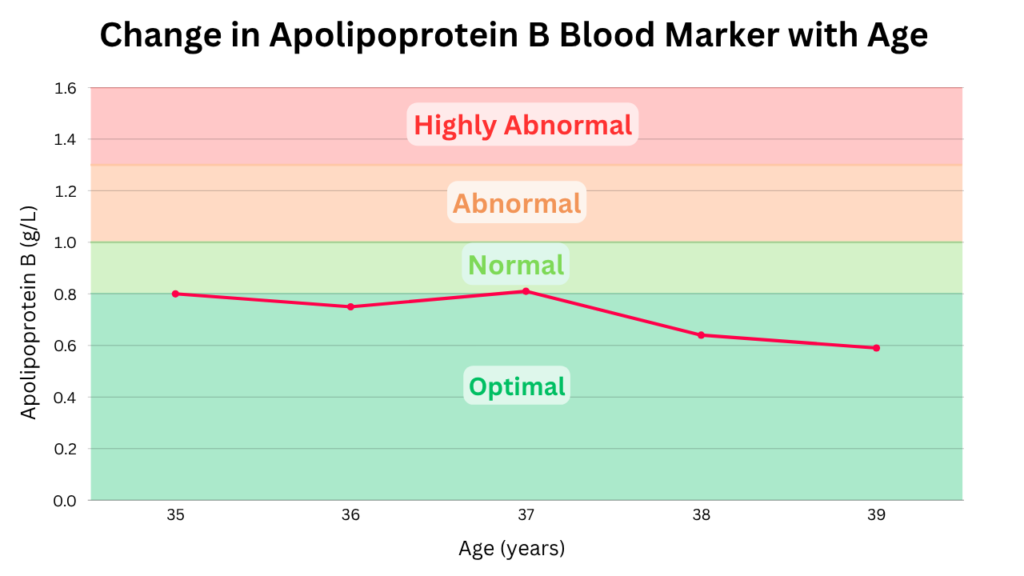
In most cases someone’s LDL cholesterol and Apo B indicate the same risk. Since private blood tests can be expensive, a sensible starting point is to monitor your LDL cholesterol each year.
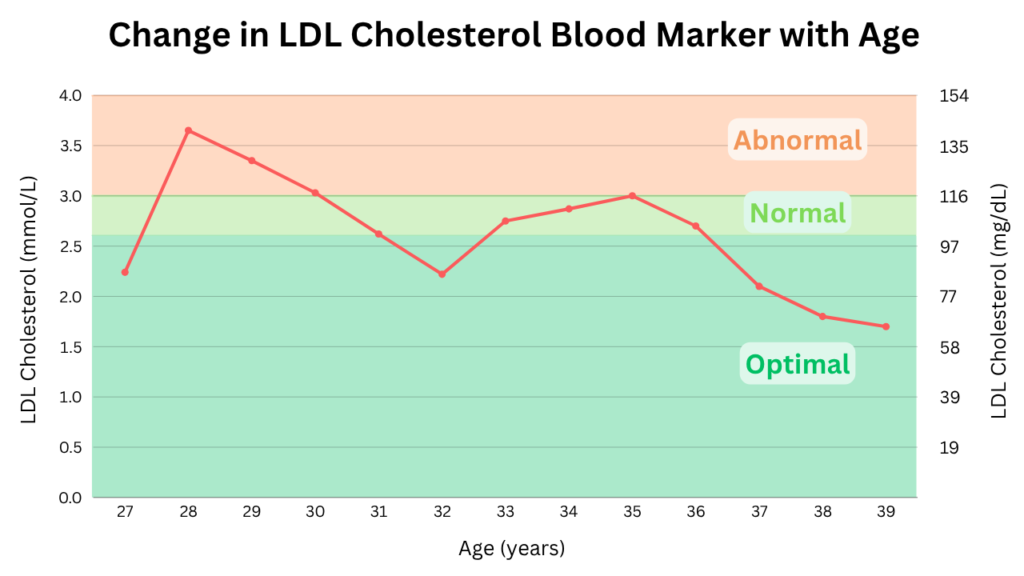
Between the age of 35 and 39 I experimented to find the diet that brought my LDL cholesterol down by 40%. By focusing on a diet high in fibre and low in saturated fat, I believe I can stay in the optimal range for many years to come. This is particularly important because the effects of high cholesterol are cumulative, and are already visible by the age of 20 [3].
Fitness
The measurements and tests for fitness are as follows:
- Resting Heart Rate – measured after 5 minutes sitting quietly
- VO2max Rockport Walk – requires a stopwatch and an athletics track
- VO2max Step Test – requires a 16.25 inch step, a stopwatch and a metronome
- VO2max Cooper Test – requires a stopwatch, a measuring tape and an athletics track
- VO2max Åstrand-Ryhming Test – requires an exercise bike and a heart rate monitor
- Breath Hold (in) – requires a stopwatch
- Breath Hold (out) – requires a stopwatch
- Front Plank for Time – requires a stopwatch
Resting Heart Rate
For this test I measure my heart rate at the time of my blood pressure, which is following 5 minutes sitting still. There is also a formula for calculating your cardiovascular fitness based on resting heart rate.
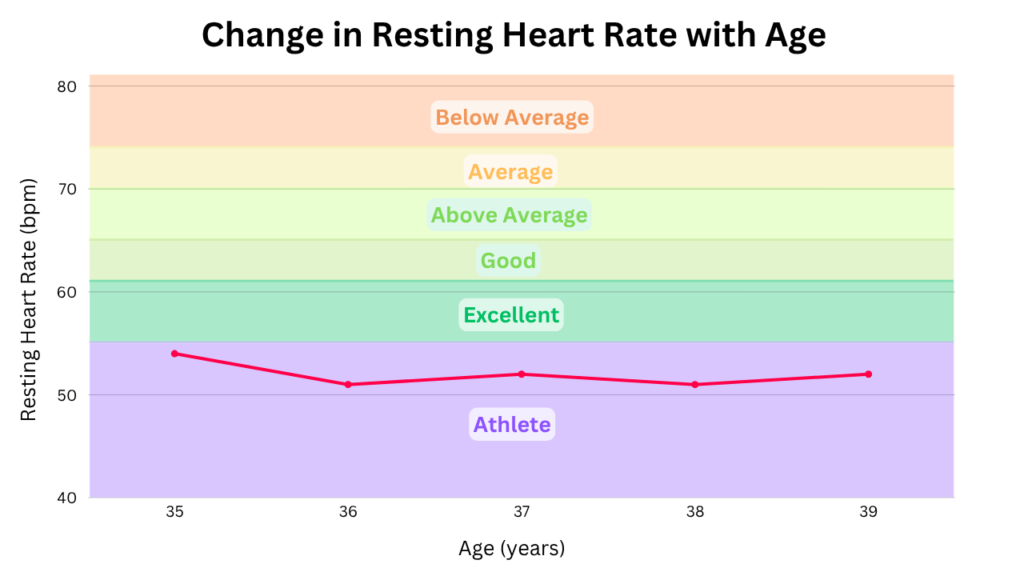
Resting heart rate is a reflection of your fitness level, and since I have always exercised regularly, mine has remained in the “Athlete” classification.
VO2 max testing
The single best measure of cardiovascular fitness is the VO2 max test. These can be conducted in a lab with a mask, but there are many different estimated VO2 max tests available.
The Rockport Walk test is a really nice introduction to submaximal VO2 max testing. It requires you to walk one mile, and the only equipment you need is a stopwatch. Another submaximal test is the Queen’s College Step test, which only takes three minutes. More recently I discovered the Astrand-Ryhming test was closely aligned to my lab VO2 max result, so it’s one I will prioritise in future years.
In terms of maximal tests, I often choose the Cooper test. Note that I am most comfortable with running as exercise, and there alternative tests for cyclists or rowers, such as the 2km Row test.
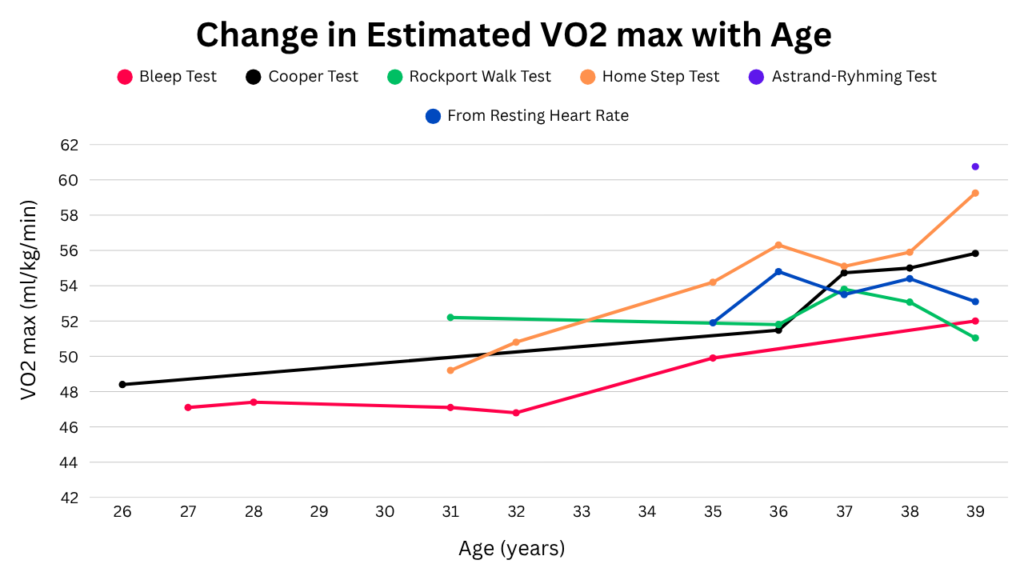
As you can see, different tests can give different results. As a sprinter I never train change of direction, which is the only explanation I can give for my poor Bleep Test scores. At the age of 39 I did a lab VO2 max test and the result (62.6 ml/kg/min) was higher than any estimated test. However, I don’t plan on taking a lab VO2 max test every year, so I will continue to complete multiple tests and take an average.
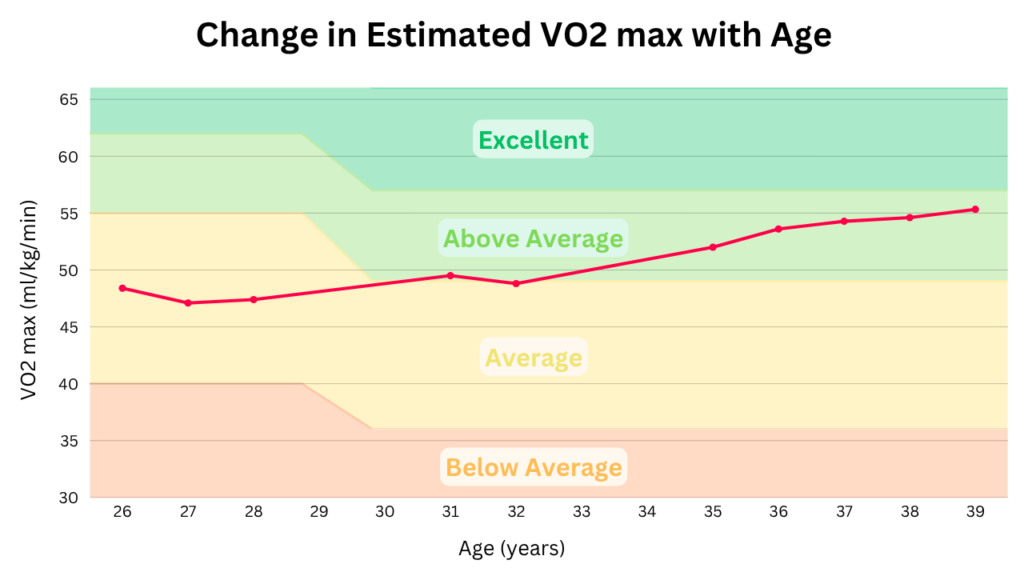
I’m really pleased with the upward trend in my VO2 max results as it’s not something I’m directly trying to improve. It’s a consequence of a cleaner diet and progressing the intensity of my training sessions year to year.
Breath Holds (in and out)
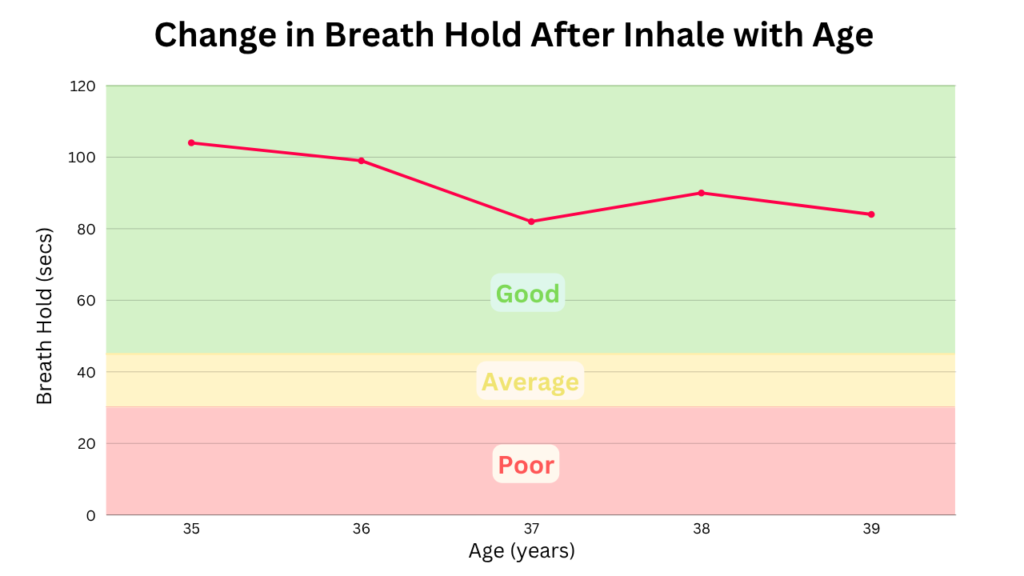
I’m sure I won’t be the only person who didn’t know that holding your breath on the “out” i.e. with empty lungs, is a legitimate test. It’s a measure of something called CO2 tolerance, which is an indication of how efficiently you breathe day to day, as well as your aerobic capacity. I only learned about this aged 37 which was the first year I measured it.
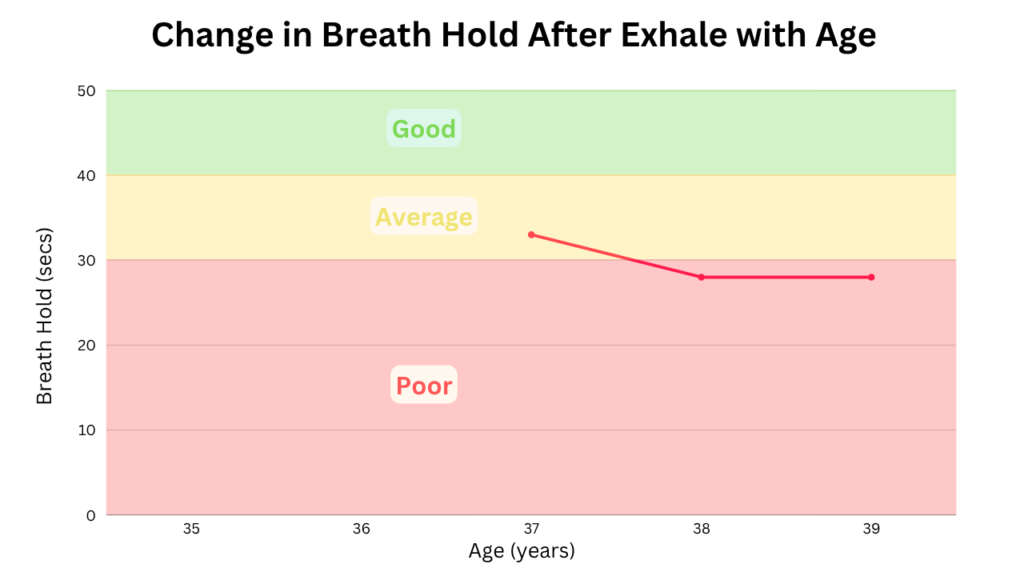
The more traditional “in” breath measures different qualities, like the ability to store and utilise oxygen, and overall lung capacity. This should be done with about 75-80% full lungs rather than taking in as much air as you can. If you are scoring under 30 seconds that’s considered “poor” and could be an indication of chronic obstructive pulmonary disease (COPD).
Front Plank (maximum time)
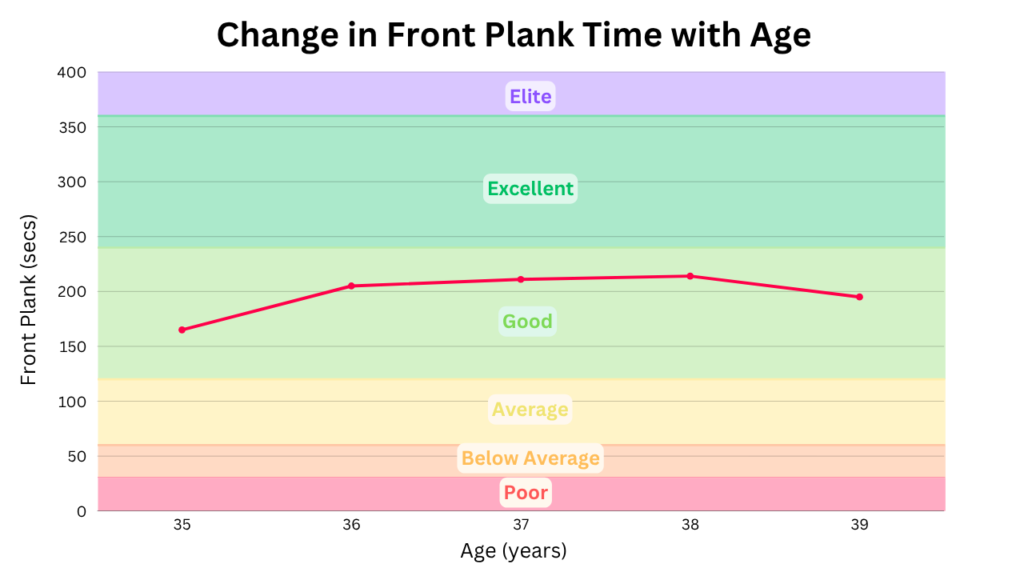
The front plank was chosen for general endurance and was one of several I picked from the list of tests on Top End Sports. It includes a scoring system, with 6 minutes required to be considered “Elite”.
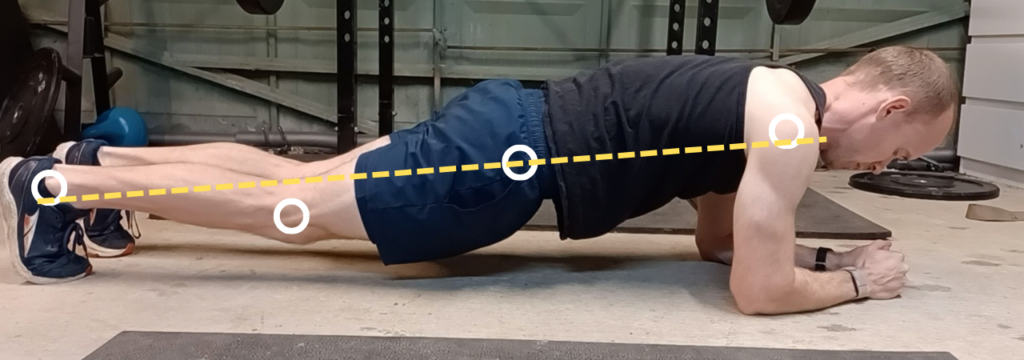
The main focus is ensuring a straight line from heel to shoulder and not sagging at the hips, and the timer stops when you can no longer hold good form.
Strength and Power
This website is called 9to5strength and not 9to5fitness for a reason – I love this type of training. I was pretty confident that the exercises I chose here offered a good overall assessment of strength and power. There was a temptation to include some sort of 1 to 3 rep max lifting weights, but for the high injury risk these were avoided. Here are the tests I selected:
- Grip Strength – measured using my Camry Hand Grip Dynamometer
- Standing Vertical Jump – measured on the outer wall of my house with chalk (tip to tip)
- Standing Broad Jump – measured with a tape measure in my garage
- Maximum Push Ups (Tempo) – measured using an online metronome
- Maximum Pull ups (Tempo) – measured using an online metronome
Grip Strength
This is one that’s often linked to overall longevity and important for the elderly [4]. Using my hand grip dynamometer, I test three times on each hand and take the highest score.
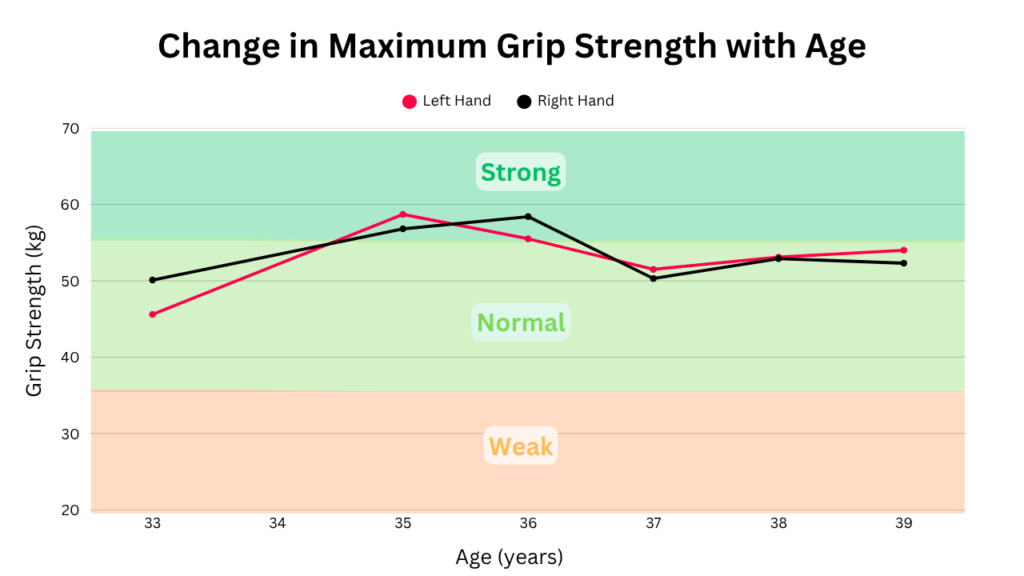
This is another instance where it’s a general reflection of my exercise level rather than anything I’m focusing on directly. Note that the literature is showing a correlation and the true association is likely to be with upper body or even whole body strength. That means direct grip work is unlikely to have much effect on your overall ongevity.
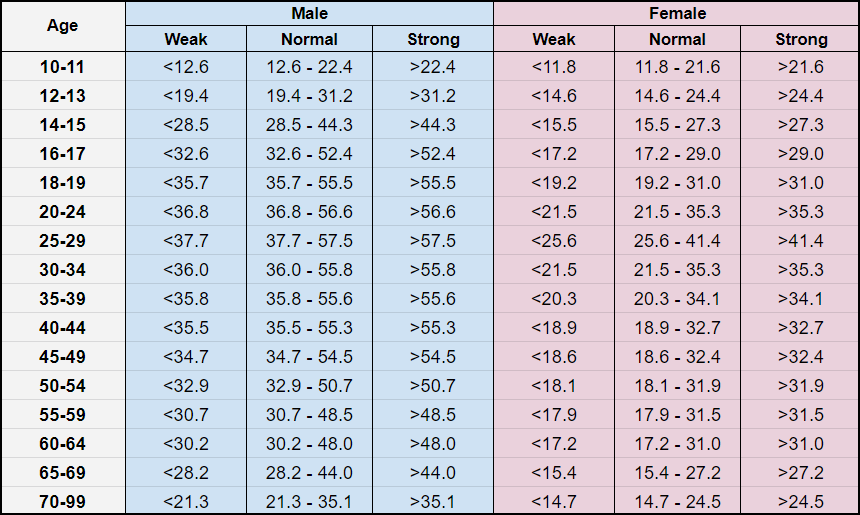
The grip strength reference range for males and females by age can be seen below. Most of the literature shows the biggest negative effect coming from a “weak” grip, so if you are in that category it should be a priority for you to improve.
Standing Vertical Jump
For the vertical jump I like the “tip to tip” method, and you can see my separate article on how to measure your vertical jump. Tests like these require a dynamic warm up, and again a best of three is a nice approach. This is a great measure of lower body power, and there’s no getting around the influence that body-weight has on your jump height.
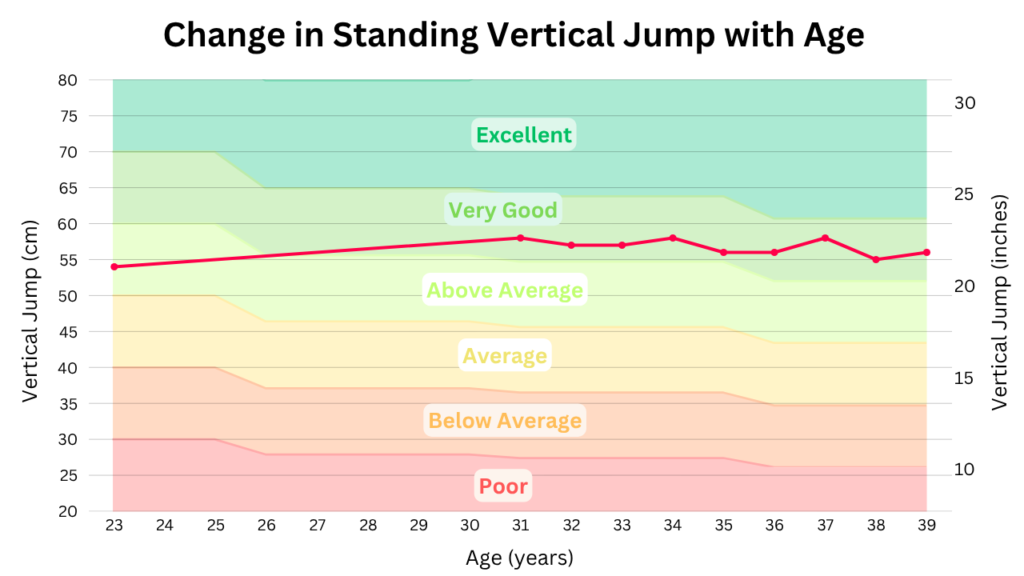
I’ve always been more of a power athlete, but my height (176cm / 5’9″) doesn’t lead itself to impressive jump heights.
Standing Broad Jump
The broad jump is another maximal test that requires a thorough warm up. Remember you’re measuring the back of your foot when it lands, not the toe. Both this and the standing vertical jump are testing lower body power, so it’s perfectly acceptable to only track one of them.
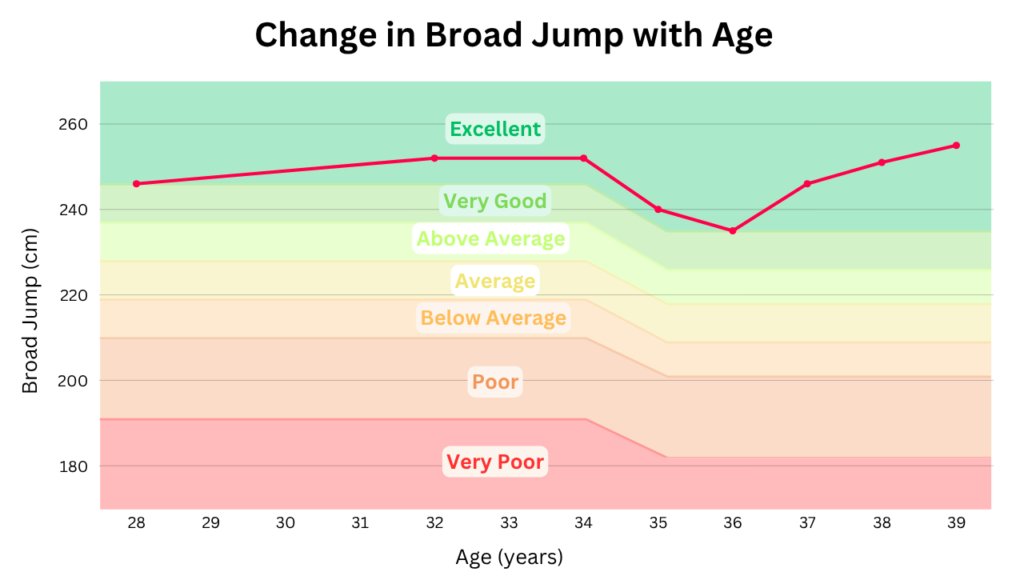
The sprint training I do is directly impacting my broad jump ability, which made me very pleased when my best jump came at age 39. This is one which I will be working hard to maintain or improve as I enter my 40’s and 50’s.
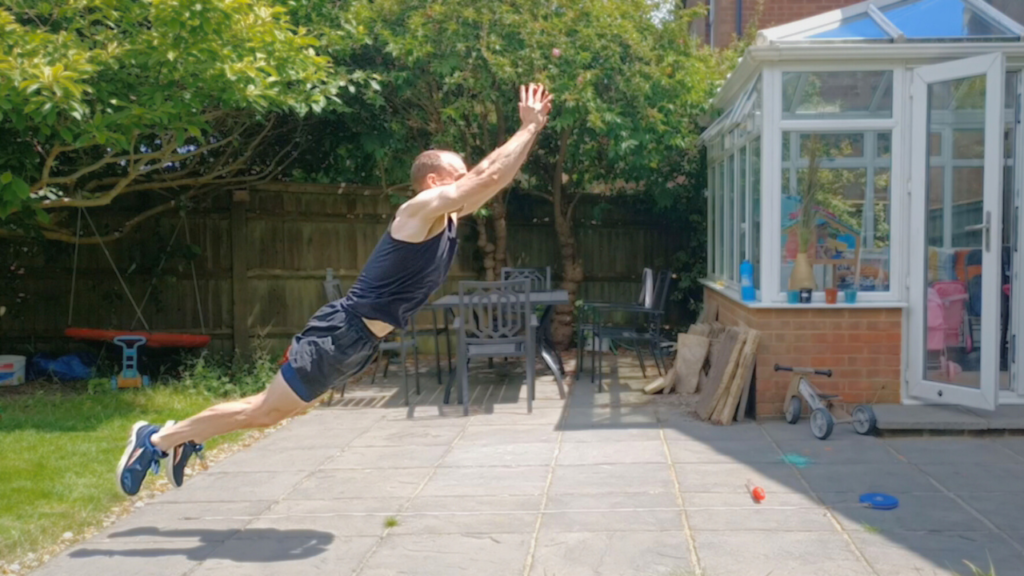
Maximum Push Ups (Tempo)
The push up test has several variations and I initially chose one with a time limit. Later on, having listened to a podcast series with Dr Andy Galpin, I switched to measuring with a set tempo. Here I set a metronome to 50 beats per minute, and I stop when I can no longer hold that tempo.
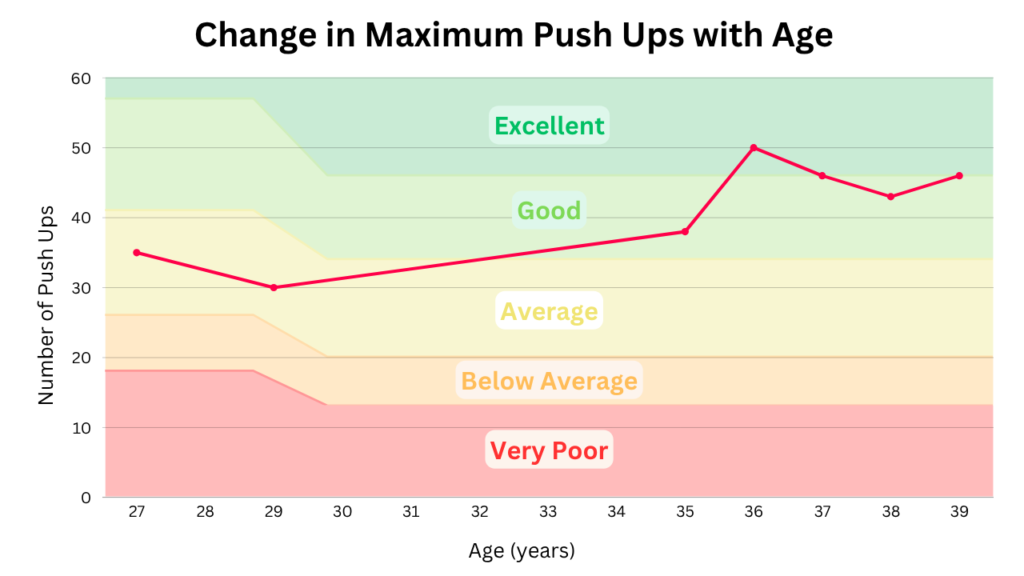
If you’re interested in push up standards for men and women they’re widely available online. You might notice the dramatic increase from 2023, which is due to following a 7 week push up program, shown below.
Maximum Pull ups (Tempo)
The final strength test I included was consecutive pull ups. It’s different enough from push ups that I wanted to include both. I made sure that my technique was solid by pausing at full arm extension. The cue I used was to pause long enough that someone could take a picture of me without it coming out blurry. This was set to 30 beats per minute, meaning only 15 pull ups per minute. This is deceptive as it feels very slow at first, but ends up being the limiting factor as you rush the final reps.
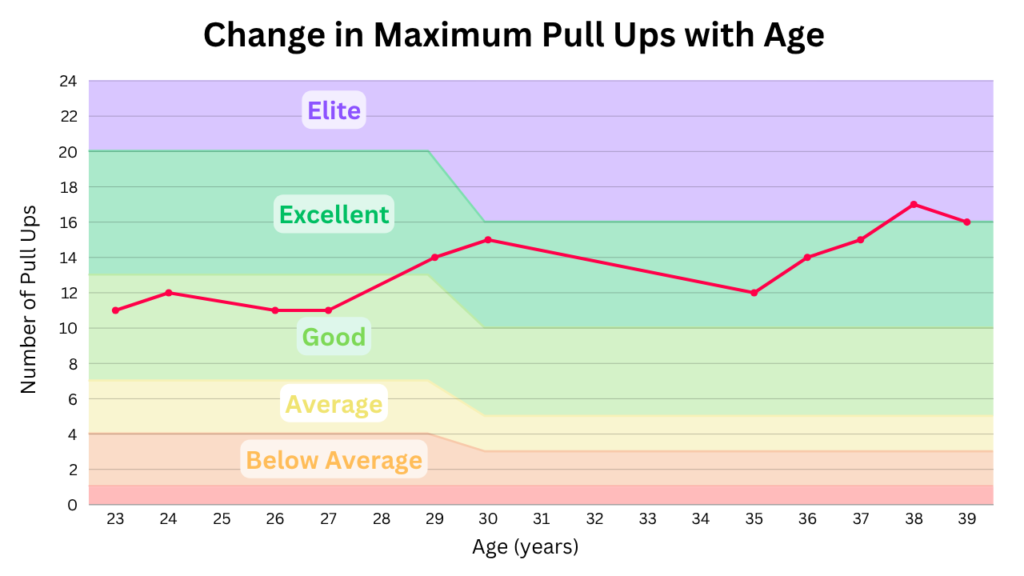
Unlike my push ups, I wasn’t able to maintain the improvements from a dedicated pull up program by the time I did my annual testing. Having got all the way up to 25 reps aged 36 I was back down to 14 reps by the summer.
Cognitive Ability
In the first year I took an at-home Mensa IQ test, but later realised I would be repeating the exact same questions in future years so it wasn’t a good option.
A free alternative was a website I’d been familiar with for a few years called Quantified Mind. They have a battery of tests called IQ version 3, which involves 11 different tests assessing a range of different mental attributes.
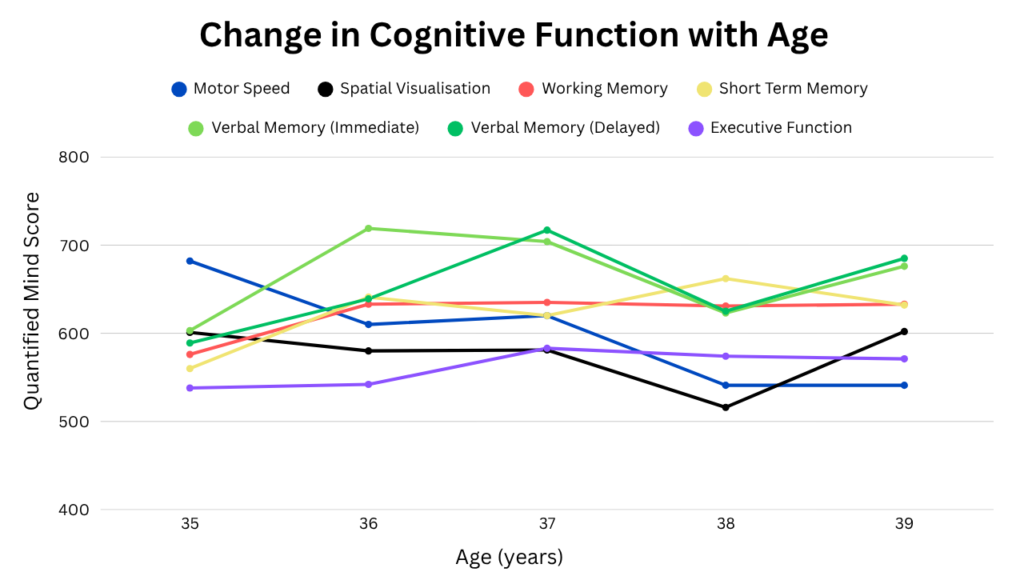
I was taking the average but also realised I could group the individual scores into seven categories. This could be useful should certain functions decline at different rates to others. For example, I notice my motor speed, as measured by a space bar tapping test, has been trending downward over the last four years.
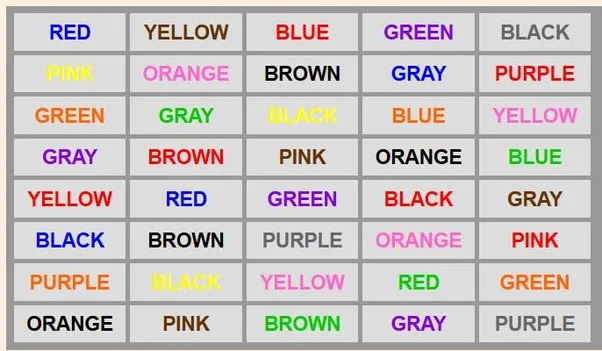
Another example is the Stroop test, a measure of executive function, which you may be familiar with (pictured below). You are shown a coloured word and you press a button that either corresponds to the colour it spells, or the actual colour of the letters.
I’m a little nervous that the website will be taken down in several years time and I’ll be stuck without a cognitive test. If you know of any suitable replacements, please get in touch!
Final Word
As you can see, it’s a comprehensive set of tests that should pick up any physical or cognitive decline with age. The majority of them can be done for free or with inexpensive equipment across a single weekend.
If you want to have a go at completing these tests please check out this spreadsheet and the accompanying playlist. I’d love for people to try them out, especially if you plan to do it every year!
References
[1] Why your waist size matters
[2] Beyond Weight Loss: Biomarker Improvements from GLP-1 Medication
[3] Risk Factors and Progression of Atherosclerosis in Youth, Wissler, Strong, 1998
[4] Associations of grip strength with cardiovascular, respiratory and cancer outcomes and all cause mortality, Celis-Morales et al. 2018
