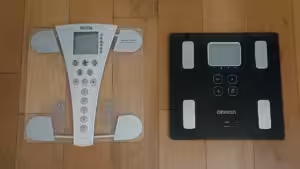
I’ve owned my Tanita BC-543 Body Fat scales for around 5 years and even made a review video for them. More recently I’ve questioned their overall accuracy and decided to shop around for better alternatives.
Having narrowed it down to the Withings Body Smart or the Omron VIVA, I opted for the latter. This was purely because I already own an Omron device that is highly rated (their M2 Basic blood pressure monitor). For the last five months I’ve been taking readings with both sets of scales until I had fifty pairs of data points. Let’s see what they showed.
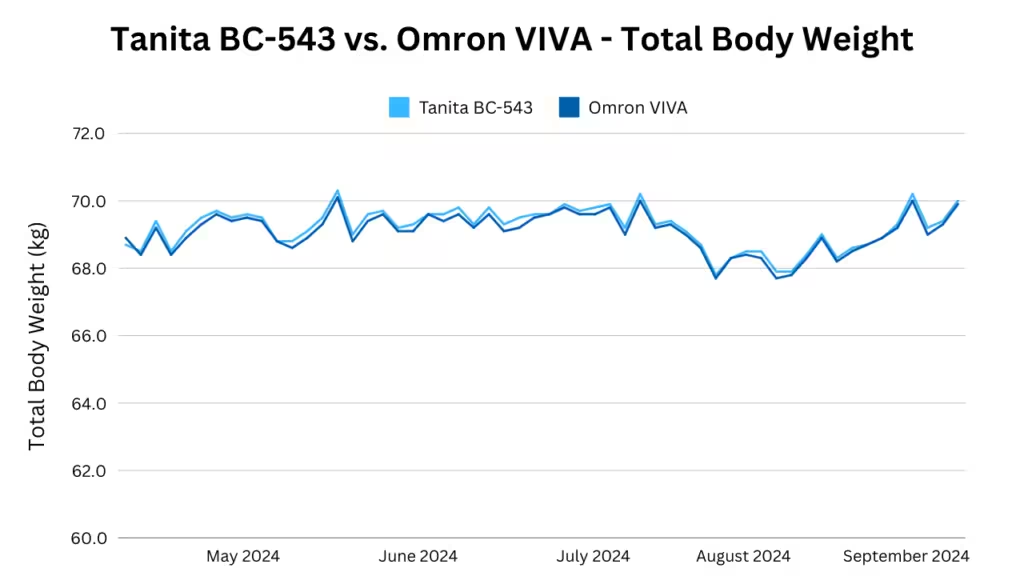
Tanita BC-543 vs. Omron VIVA – Total Body Weight
It’s an uphill struggle if the scales can’t align on such a basic metric as my overall body-weight. Thankfully they were very strongly correlated (r = 0.99) with Tanita consistently reporting me 0.1 to 0.2kg heavier.
Tanita BC-543 vs. Omron VIVA – Muscle Mass %
When it comes to percentage of muscle mass, Tanita and Omron report this in completely different ways.
- Tanita BC-543: includes all types of muscle, as well as water stored within the muscle. This is very close to “fat free mass” but excludes bone mass.
- Omron VIVA: reports skeletal muscle, which doesn’t include other muscle like the cardiac muscles of the heart or muscles in and around other organs.
I’ve plotted them on separate y-axes so you can hopefully see that, despite having completely different values, they share similar fluctuations over time.
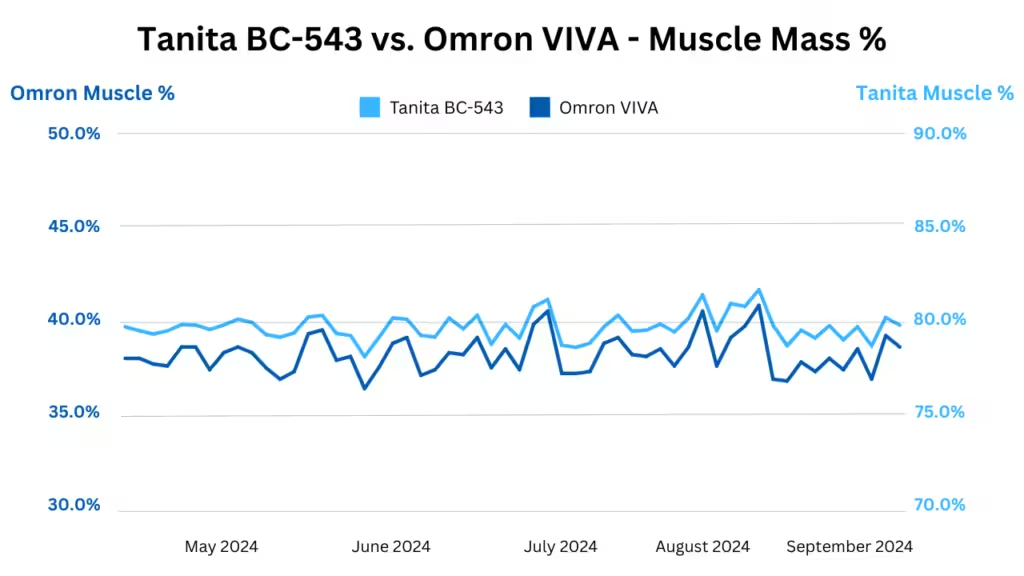
The missing piece that explains these fluctuations is something very relevant to body fat scales, which is hydration level. In any discussion of the accuracy of “bioelectrical impedance” scales, it’s often stated that they struggle with varying levels of hydration.
Tanita BC-543 – Total Body Water %
Tanita’s measurement of total body water percentage has a correlation with percentage muscle mass of r = 0.988. Additionally, it has a correlation of r = 0.947 with the percentage muscle mass as reported by the Omron scales.
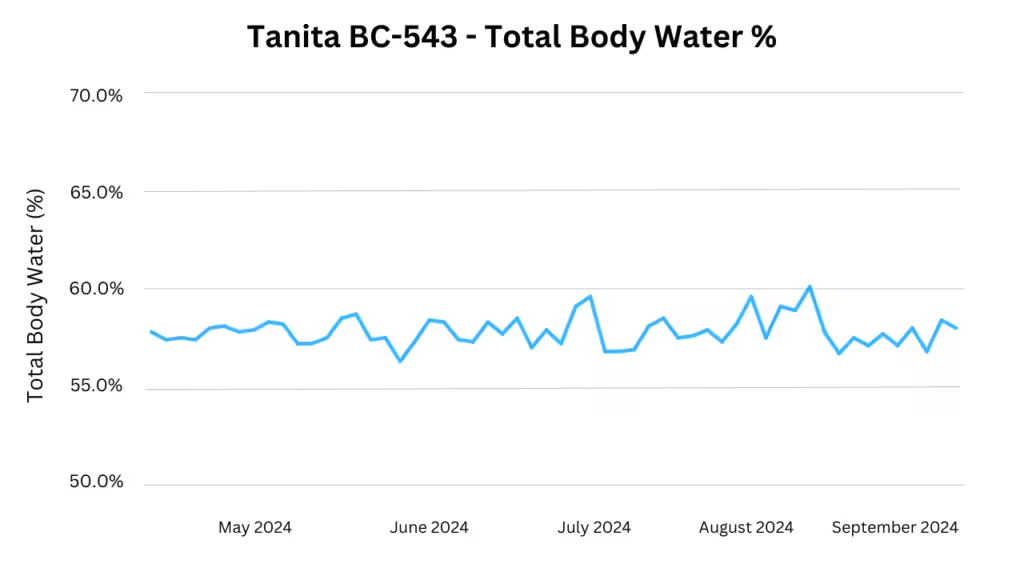
The good news is that, despite having such a strong influence on the scale reading, if you know your total body water at the time of the measurement, you can adjust for it. This is something I’ve been doing for years. I first established the relationship between the two before settling on an adjustment factor.
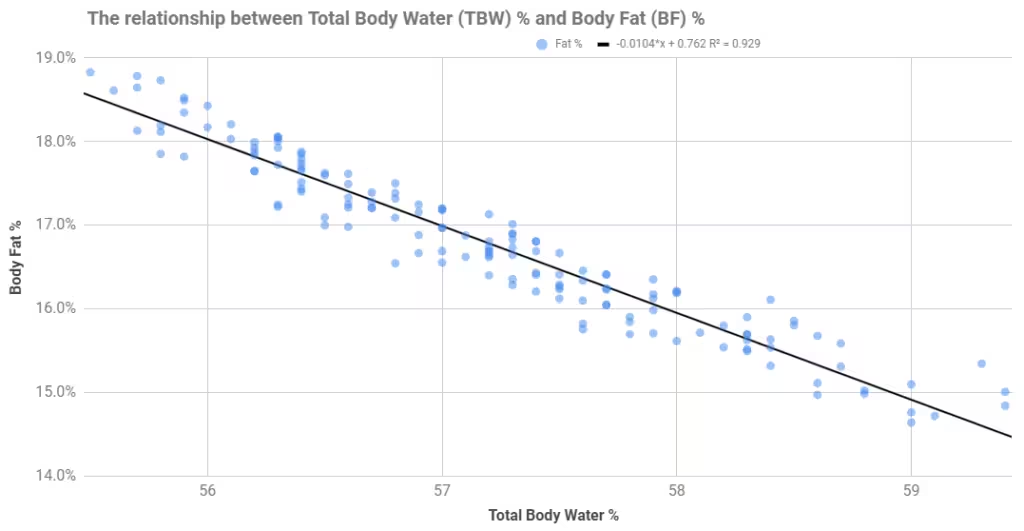
Here I’ve actually plotted total body water against body fat percentage. Due to the way Tanita reports muscle mass, a similarly strong relationship exists between body water and body fat (r = 0.929). The slightly lower correlation here is because the data was gathered over the course of a year, in which time my body fat will have fluctuated slightly.
If you note the background grid on the graph, you’ll see that the line of best fit is roughly one square down for every one square across. That relationship implies that for every 1% higher my total body water on a given day, it will report my body fat to be 1% lower.
The final step is to define what a “normal” total body water percentage should be, and to adjust everything to that. Below you will see the guidelines that most body fat scale manufacturers provide, which is split by sex. Some online resources have a separate range for older individuals, who on average have lower total body water levels.
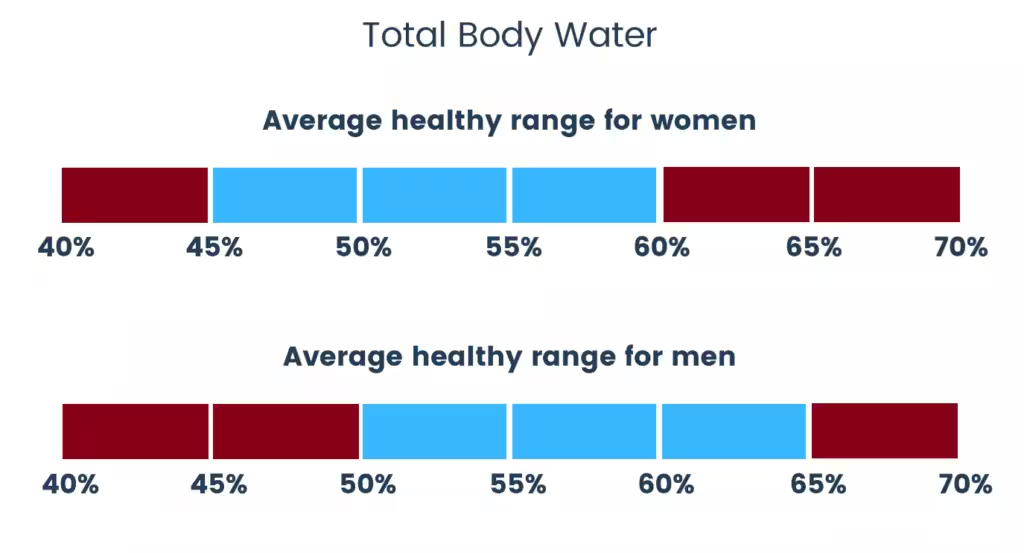
I take the mid-range of males, 57.5%, and adjust both my Tanita body fat percentage and muscle mass percentage accordingly. For example, if I am 14% fat, 82% muscle and 60% water, I would adjust my body fat up by 2.5% and my muscle down by 2.5%.
Tanita BC-543 vs. Omron VIVA – Corrected Muscle Mass %
If we apply that logic to the muscle mass percentages reported by both sets of scales, we get the following graph. Note that in reality this wouldn’t be possible using only the Omron data, as they do not report total body water.
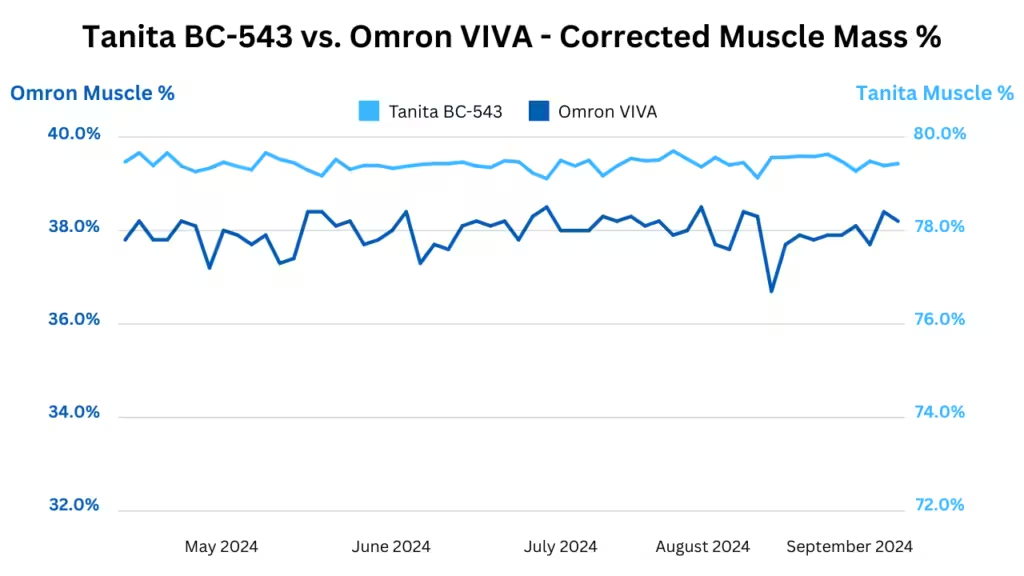
Now the data might appear to be just as noisy as before, but that’s because the correction has allowed me to zoom much further in on the axes. On previous graphs the gaps between horizontal lines represented a 5% change, and now it’s only 2%. My Tanita readings differed by as much as 3.5% across the four months, whereas now it’s a range of 0.6%. Omron’s range is down from 4.4% to 1.8%.
Tanita BC-543 vs. Omron VIVA – Body Fat %
With all the foundational work laid, you can hopefully fully appreciate the final dataset to be visualised – body fat percentage.
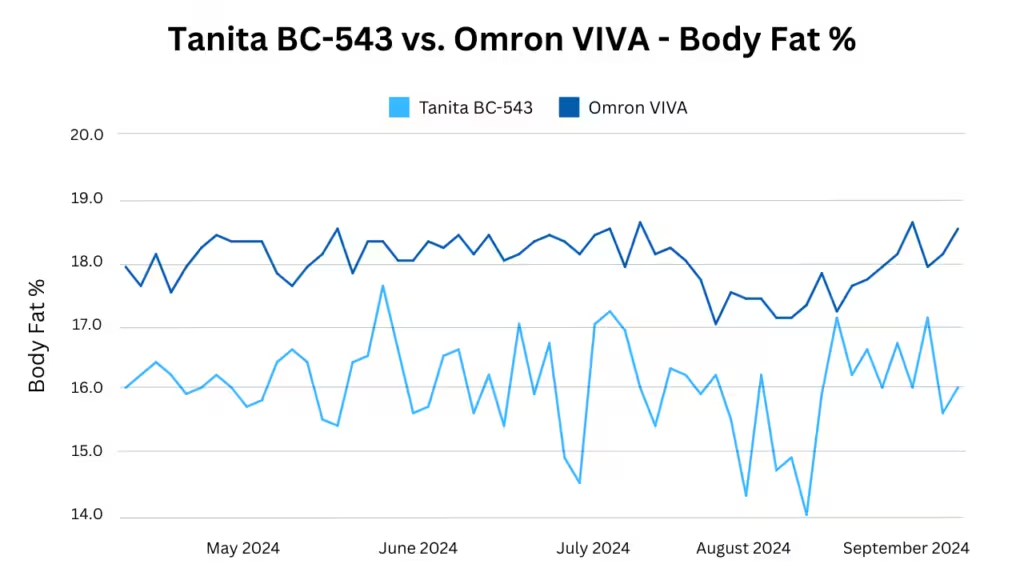
What I found most interesting about this plot is that these are the raw numbers, yet it looks like the Omron VIVA is automatically adjusting for total body water. It becomes clearer when I apply my correction factor to the Tanita values, as shown below.
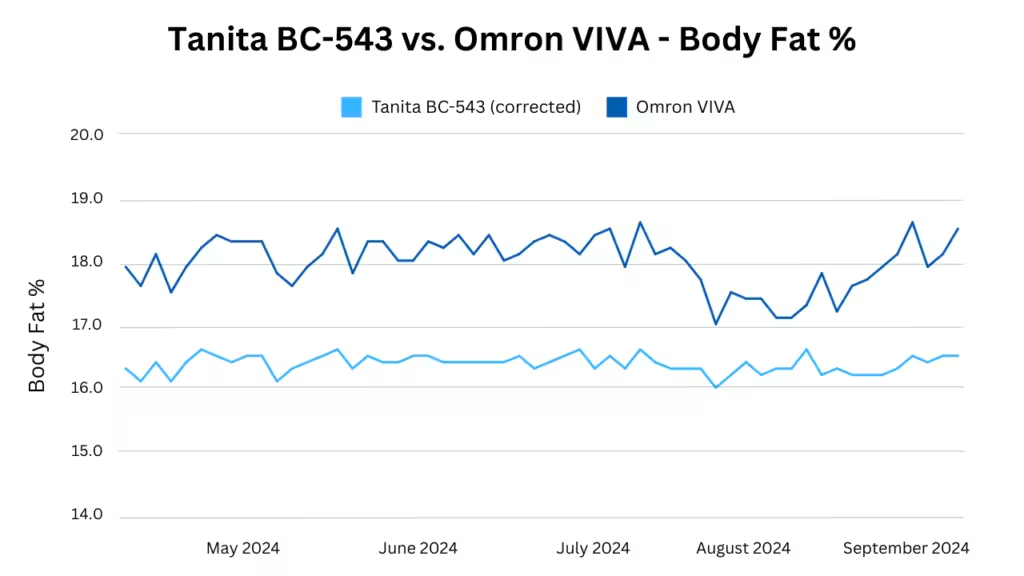
You can see the peaks and troughs mirror each other to some extent, with two main differences. Firstly, Tanita report my body fat to be around 16.5%, while Omron report a higher value of 18.2%. Secondly, from late July there is a dramatic downturn in my Omron body fat that isn’t reflected in Tanita’s values.
So what happened in late July? I deliberately restricted calories, going from ~2650 kcal/day to ~2150 kcal/day for a period of 12 days. Without having a truly accurate measurement, I can’t say which set of scales is correct, but I am leaning more towards the Omron VIVA. The reason I did this experiment was that my Tanita body fat percentage barely moved following a five day very low calorie diet, which made me question its accuracy.
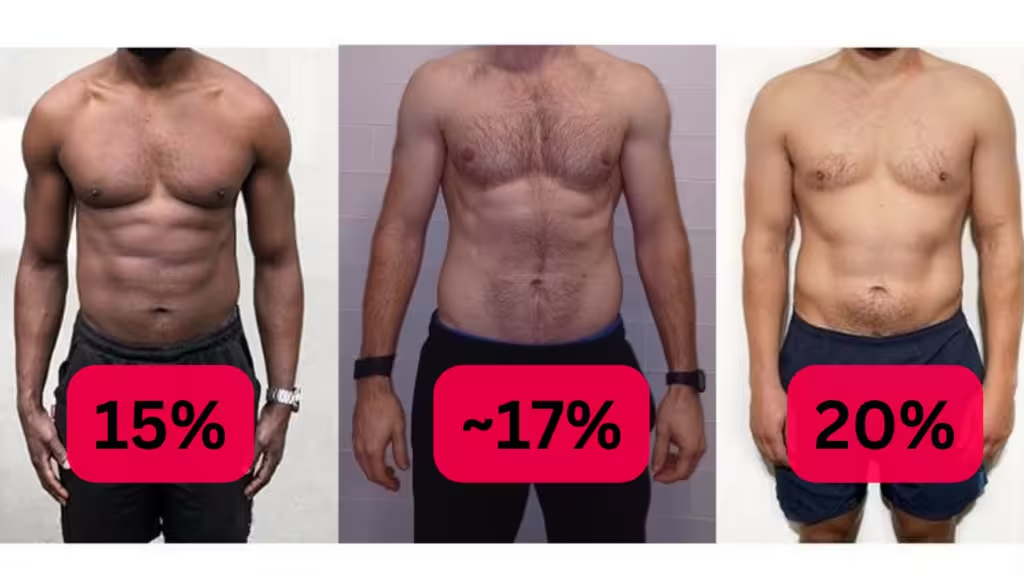
As for whether 16.5% or 18.2% is closer to my true body fat, that’s actually less relevant than capturing fluctuations. However, I’ve previously used online images of body fat levels to calibrate. While I’m confident that I lie somewhere between 15% and 20%, it’s harder to tell which I’m closer to. My torso is labelled 17% as that was my Tanita value at the time. If you told me my true body fat was 18.5%, as Omron VIVA would have it, I’d find it hard to argue.
Conclusion
Sadly I don’t have a clear indication of which scale is “better” or more accurate. The Tanita BC-543 reports total body water, which helps me correct for fluctuations. However, if a scale has the capacity to autocorrect, then total body water is no longer required. The Omron VIVA appears to factor in total body water when reporting body fat, but not muscle mass.
The Omron VIVA moved more in body fat percentage in two weeks than my Tanita scales have in 5 years. I have 218 Tanita measurements between June 2019 and September 2024. My highest corrected body fat in that time is 17.1% and the lowest was 15.8%. While I am very consistent in my exercise and diet, I’m starting to doubt the numbers it’s reporting.
While neither scale is perfect, I am closer to favouring the Omron VIVA when tracking over time. I would like to dip into the market and try another few scales, starting with the Withings Body Smart. I may also do a more sustained period of calorie restriction to see which scales best capture the changes.
