Having monitored my glucose response to certain individual foods, I wanted to see how it fluctuates across a full day. What better day to choose than one of indulgence – Christmas Day.
A reminder that in my initial testing a large baked potato on its own was responsible for my highest peak of 7.8 mmol/L.
Blood Glucose – What’s Normal?
As shown below, blood glucose levels are often measured following an 8 hour fast. If your values are above 5.5mmol/L (99mg/dL) you would be classified as pre-diabetic and if they are above 7.0mmol/L (126mg/dL) that would be diabetic (type II).
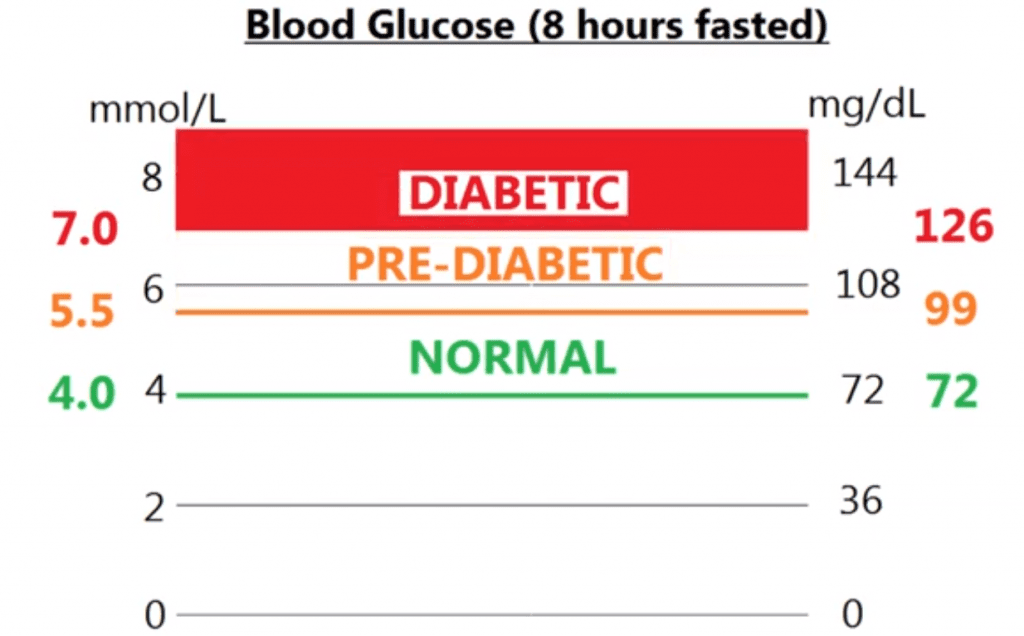
A healthy response to consuming food is for your blood glucose to rise, and then come back down below 7.8mmol/L (140mg/dL) within 2 hours after the meal. Depending on the macronutrient content (protein, carbohydrate, fat) and total calories of the meal, it’s possible for blood glucose to peak below these levels.
My Blood Glucose Response
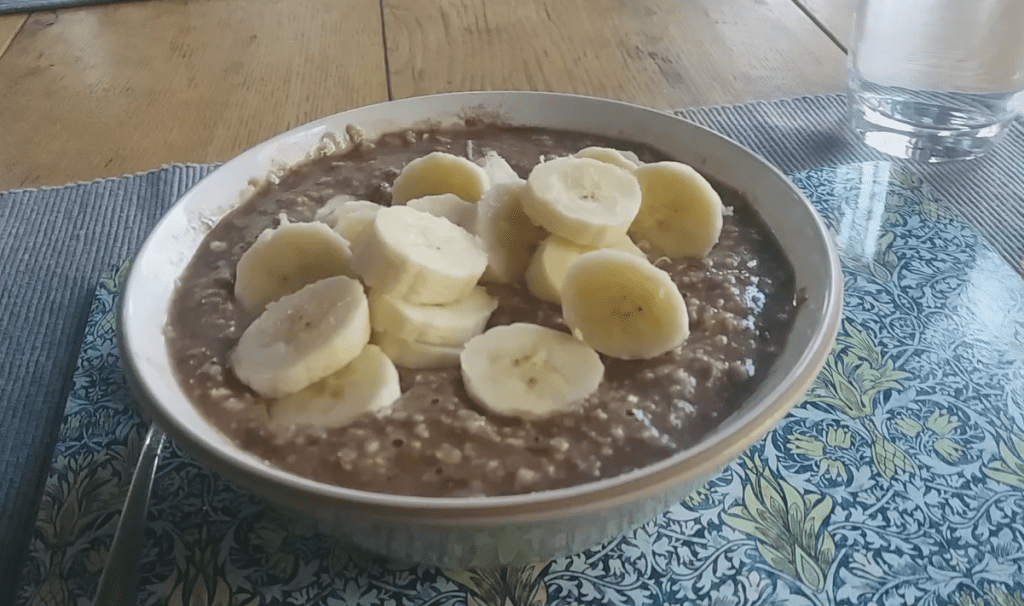
Breakfast – 11.30am. Breakfast was my usual meal, around 100 grams of porridge oats, a chopped banana, and a 30g scoop of whey protein. This is a high carb meal with very little fat in it, and my glucose spiked at 6.8mmol within 30 minutes, before falling to 4.7mmol/L an hour later.
Protein: 51g, Carbohydrate: 100g, Fat: 13g, Total Kcal: 704
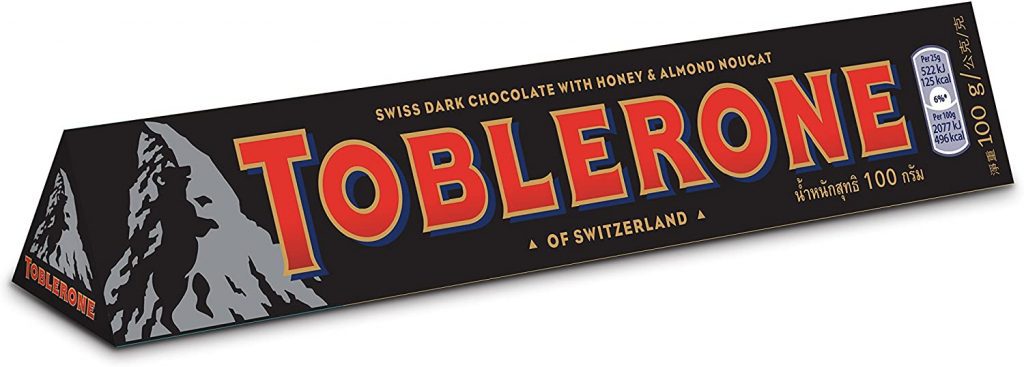
Snack – 4.00pm. I went to the gym around 2.30pm for 75-80 minutes, mainly resistance training. On my return I tucked into my stocking filler, a 100g Dark Chocolate Toblerone. Previous experience has taught me that foods containing a certain amount of fat can blunt the peak glucose response, and indeed it rose to 6.3mmol/L on the hour, and had dropped to baseline levels soon after.
Protein: 5g, Carbohydrate: 61g, Fat: 31g, Total Kcal: 546
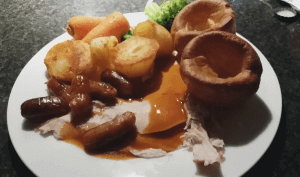
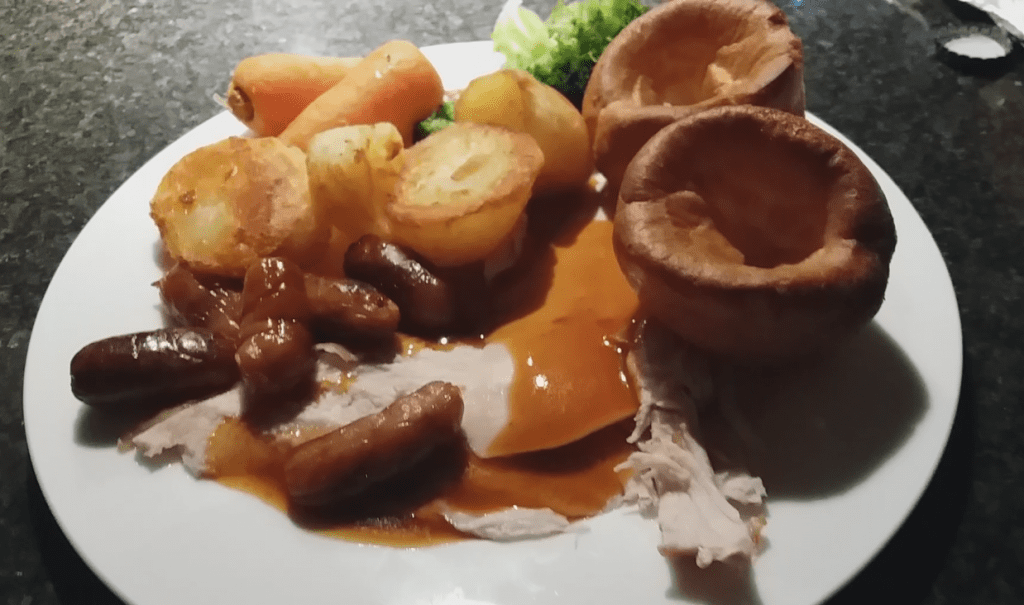
Christmas Dinner – 6.30pm. My sister loves yorkshire puddings so those feature in our otherwise traditional meal. I went back for seconds and was a little surprised to see my glucose go no higher than 6.0mmol/L before coming down again.
Protein: 63g, Carbohydrate: 72g, Fat 34g, Total Kcal: 855
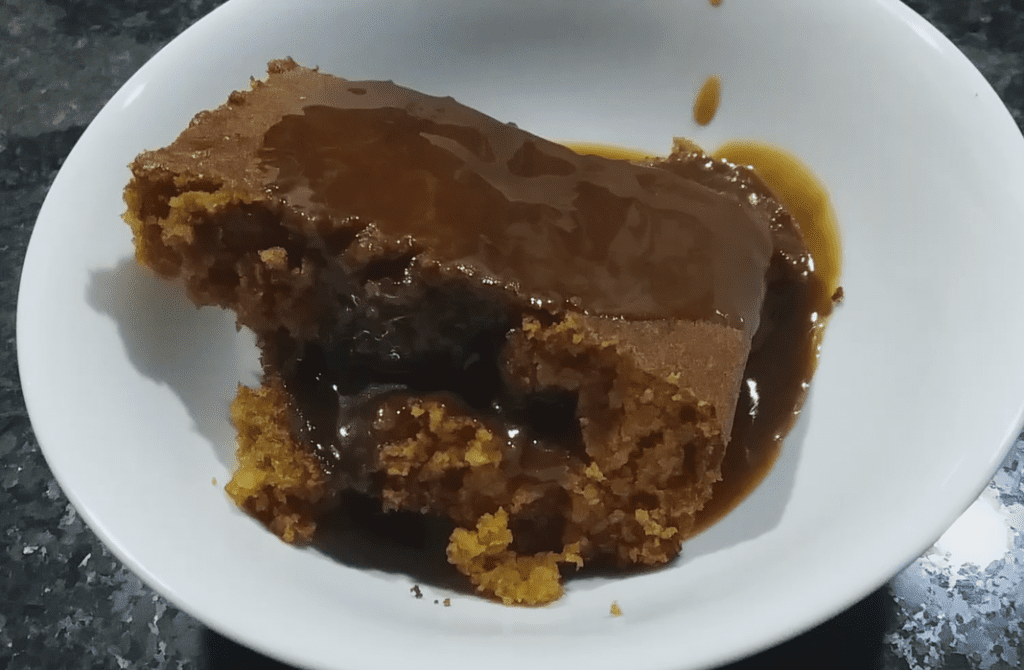
Dessert – 8.00pm. One last attempt at something substantial, a decent portion of sticky toffee pudding covered in toffee sauce, followed by a Lindt Chocolate Teddy. Fats can cause a slow rise and carbohydrates a rapid one, and the combination of foods in my stomach left my glucose fluctuating around 5.5mmol/L. The highest value was 90 minutes after dessert, at 6.4mmol/L, still lower than my porridge oats, and it dropped rapidly to 4.0mmol/L by 10.30pm.
Protein: 10g, Carbohydrate: 69g, Fat: 47g. Total Kcal: 730
As you can see from the graph below, the most impressive rise was from my morning oats with banana. What’s more important for controlling blood glucose in the long term is the AUC, or Area Under the Curve. A food that peaks at 7.0mmol/L and rapidly falls may not be as problematic to your health as one which holds at 6.0mmol/L for a longer period. As the measurement is the amount of glucose circulating in your blood, values above your own natural baseline indicate that the glucose hasn’t been fully dealt with yet.
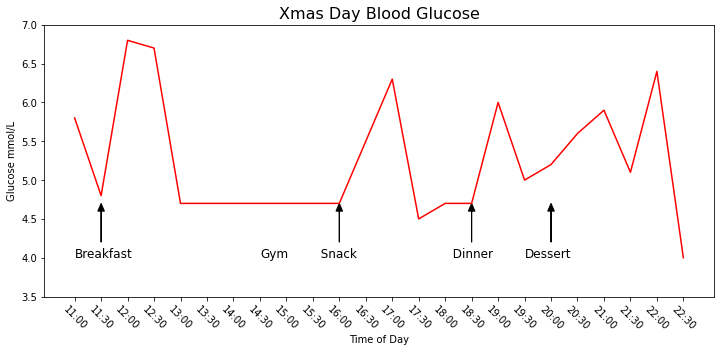
Overall I’m quite surprised that in this experiment there was no real correlation between healthiness of food and glucose response. My biggest rise came from porridge oats and a 1600kcal evening meal involved a sustained rise, but no outrageously high peak.

